Based on 5 indicators, credit cycles, current account and trade balances, financial position of the concerned country, risk aversion and the alignment of rich and poor nations, we explain the price movement of FX prices on a fundamental data basis.
Please read the first part “The Five Main Factors That Determine FX Rates (chapter 1)” in order to understand these factors.
Funding currency
The funding currency is not the primary indicator for FX rates, but the criterion logically follows the other five. Between 2007 and 2012, during the bust phase of the U.S. credit cycle, the dollar has been the funding currency for carry trades and the financing of growth abroad. This was stopped thanks to a massive QE3 intervention in the housing market and due to the lack of better investment targets; while, QE2 triggered a huge investment flow to emerging markets that lead to high inflation and less competitiveness for these countries.

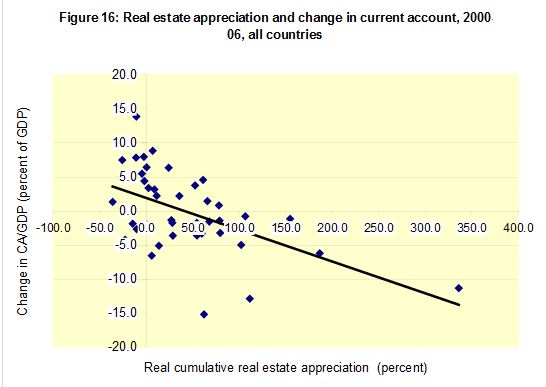
Negative Correlation between Current Account Deficit and Housing Market (source Obstfeld/Rogoff)
Until 2007, countries with current account surpluses, Japan and Switzerland, were used as funding currencies during the real estate booms of countries with current account deficits, like the U.S., the U.K, Ireland or Spain. At the same time, growth differentials between emerging and developed were big, Swiss and Japanese companies used cheap local rates to expand globally.
Imported products from Asia helped to reduce inflation in developed nations and increased real GDP. Moreover, it sustained their companies thanks to global expansion.
Consequently, Western central banks left interest rates at low levels. The following graph shows how, thanks to unusually cheap interest rates in deficit countries and to bad lending practices of banks, the housing market of countries with current account deficits improved excessively.
An example for using the funding currency is margin debt. From 2009 onwards, investors often obtained credit with U.S. government bonds or bills as collateral. They then use the funds for riskier investments either in a local or foreign investment currency. This margin debt was considered to be nearly risk-free because the Fed was expected to destroy the purchasing power of the dollar via inflation: a weaker dollar was expected.
Yen versus Dollar as Funding Currency
The Japanese Ministry of Finance (MoF) wants to achieve higher inflation, similarly a destruction of the yen’s purchasing power. With some improvements in the U.S. housing market and far lower risk aversion, the yen is now the preferred funding currency.
A funding currency typically appreciates when stock and commodity markets fall and vice verse, albeit there is small difference. While the yen shows clear reverse movements against stock markets, the U.S. dollar exhibits more inverse behavior against gas and oil prices. Good fundamental data for a funding currency, such as less unemployment in the U.S. or strong growth in Japan, often results in a weaker commodity (case of dollar) and stock prices (yen). Investors fear that the central banks will invalidate their cheap funding.
Currencies in a boom phase of the credit cycle, like the Swiss franc, cannot be a funding currency, at least as long as the European periphery does not shows signs of exiting the bust phase; recent lower government bond yields for Italy or Spain are first, but possibly misleading signs.
Japan, however, has the ultimate funding currency, because there is no sign of a boom and thanks to a 15 year-long tradition of deflation, weak demographics and rising high public debt, interest rates seem to be bound to zero forever.
As long as at least some countries like Germany show relatively strong growth and potential inflation, the euro cannot be a funding currency. The reason is that the ECB has a mandate that concentrates on inflation and not a double mandate, inflation and growth, like the U.S. Fed. This implies that the euro can weaken despite German growth only in a very risk-averse scenario like the one in Summer 2012. In the year 2000, however, during the U.S. dot com bubble, the euro was the preferred funding currency.
Algorithms and fundamental data
Quantitative algorithms (“algos”) follow these principles visible in daily movements of FX rates. Day to day behavior of currency and stock market movements reflect algorithmic rules that are common among major investment banks and hedge funds. They have been valid for decades but with the introduction of quantitative programming even intensified. These rules are:
- The market is efficient, which implies that current valuations are correct.
- Quantitative algorithms condense economic data like GDP, interest rates and balance of payments in data and potentially even new rules. The latter means that the algorithm learns.
- Good or better than expected data leads to improvements of the concerned currency/market, weaker data to a weaker currency/market. The movement is adjusted for historical volatilities, e.g. the EUR/JPY movement is far stronger than the one for EUR/CHF.
- Currencies with a strong financial position and those with current account surpluses, the so-called “safe-havens”, appreciate with bad economic news.
- Currencies of countries that are in the boom phase of the credit cycle often appreciate with good economic news, no matter from where the news emerges. Countries that are currently in a boom phase are Germany, Norway, Switzerland and some emerging markets. Lately, the United States has shown some indications of a boom and rising real estate prices, while China and other emerging markets show slower growth. Both reasons (potential U.S. boom and weak China) and weakening commodity prices, for us, are reasons why Australia, New Zealand and Canada seem to be at the end of their long-lasting boom phases. U.S. funds are leaving these countries and turning back to the States.
Different indicators may show diverting tendencies: Switzerland is in a boom phase of the credit cycle, it is still a country with a strong financial position and with current account surpluses. Until 2011 risk aversion was very high and emerging markets were expanding far more quickly than the U.S..
This combination of the five major factors led to a strong revaluation of the franc between 2008 and 2011 from EUR/CHF undervalued at 1.60 to overvalued at 1.01 and finally 1.20. Since then, the U.S. and risk-appetite has recovered, emerging markets have slowed.
Virtuous and vicious cycles: Business cycles
FX rate appreciation triggered by capital inflows often leads to more investments that boosts growth. If the FX rate does not rise too much, and when exports are not very price-sensitive, then this is not a problem for the country concerned. It may even lead to a boom phase of the credit cycle. Examples are Switzerland since 2008 (appreciation of the CHF), Ireland between 2000 and 2007 (appreciation of the euro) or Australia from 1992 until today.
But also in the short term, there is a certain virtuous circle: good news is followed by better business and consumer sentiments, which again helps to achieve better economic data. On the other hand, bad sentiments follow bad news that again causes economic data to become worse: a vicious circle. Longer virtuous and vicious cycles are reflected in so-called “business cycles”, cycles that were far shorter than the typical 14 years of credit/Joseph cycles.
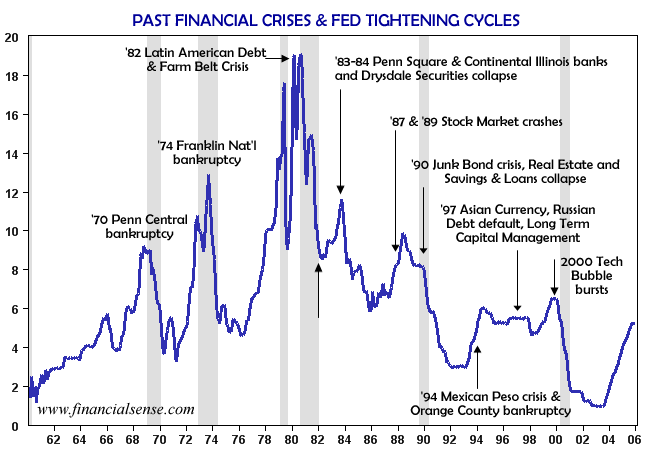
The typical backstop of all improvements in business cycles are high oil prices and inflation. Rising oil prices cause risk aversion to increase strongly and often stops U.S. expansion. Central banks try to limit inflation and hike interest rates with the effect that investments are reduced and boom phases end. In recent history, busts of boom phases have mostly been caused by Fed tightening, an increase of interest rates.
Central banks
In recessions or weak growth phases, central banks try to create virtuous circles with lower interest rates and quantitative easing. According to the IS-LM model, these short-term central bank-induced artificial virtuous circles are neutralized after 6-18 months, in the “mid-term”, by rising inflation. None the less, often central banks can beat excessive risk aversion, that does not reflect fundamental data. Sometimes central banks are able to shorten bust phases of credit cycles and/or to distort unwanted longer-term rational expectations: one example was Volcker’s victory in 1982 against the rational expectation that inflation must increase each year.
Pimco’s El-Erian recently suggested in “the reverse Volcker moment” that the unlimited aspects in the Fed’s QE3 aims to destroy the common rational expectation that “the U.S. housing market and U.S. growth will be weak for many years” (here Robert Shiller utters this common opinion). Therefore, Bernanke promises to help out each time when problems occur and unlike in September 2011 when he feared inflation and did not assist markets.
While Volcker helped America, but destroyed global growth with his high rates and sent South America to a lost decade, El Erian reckons that the Fed is now ready to accept high inflation in order to achieve stable growth and low unemployment.
Asian bloc versus American bloc
The differentiation into the Asian bloc and American bloc is quite important for price movements driven by algos. The most important countries for economic news and drivers of FX rates are the United States and China, thanks to their high total spending and strong growth.
- Good or better than expected fundamental data in China leads to a weaker dollar – even against the yen – and to higher commodity prices and stronger currencies in the Asian bloc, especially the “bullish” ones: AUD (FXA) and NZD (BNZ), but also NOK (NORW) that profits on higher Brent oil prices, the principal oil benchmark in Asia.
- Good or better than expected data in the United States helps USD/JPY and stock markets to make advances. In phases when the USD is the principal funding currency, “bullish” currencies of the American bloc appreciate: CAD, the Mexican peso, GBP and the Swedish Krona rise. SEK (FXS) is strongly related to technology and stock markets and often moves with the American bloc. Sterling is related to rising incomes of US and British banks and banking employees. As opposed to CAD and MXN, the British pound and SEK rise when oil prices are relatively low but stock markets improve.
- Swedish exports are more concentrated on Europe than the ones of Switzerland or their neighbors Norway (e.g. Brent is the Asian oil benchmark) and Finland. The latter three have a far bigger exposure to Asia. Therefore CHF and NOK move more with the Asian bloc.
- In periods when the U.S. dollar is the investment currency and Asia is weak, this may lead to irrational exuberance. An example is the Asia crisis in 1998 accompanied with potential strong U.S. productivity growth that led to the dot-com bubble.The investment environment of 2013 slightly resembles the one from 1999: China and other emerging markets have weakened, while the U.S. housing market has recovered, albeit U.S. productivity has not risen yet.
- Weak or weaker than expected data in the United States leads to an appreciation of the “bearish” currencies of the Asian bloc, the ones with low interest rates; namely, the JPY, SGD and CHF – these have trade surpluses with Asia, while the U.S. has a big deficit.
- Weak or weaker than expected Chinese data leads to appreciation of the “bearish” currencies of the American bloc: despite recent improvements this remains the US dollar.
- Continued quantitative easing (QE) in the U.S. typically triggers a weakening of the dollar and an appreciation of all currencies of the Asian bloc, both bullish and bearish ones, including gold and silver. An end of QE or “tapering” does exactly the opposite. Japan QE leads to a weaker yen and an improvement in the American bloc, but to a far smaller price movements.
- Gold and silver behave like currencies and describe the growth differentials between the Asian and American blocs, they rise with higher growth and demand in Asia and other emerging markets, but they fall when the U.S. advances, see full details.
The euro is somewhere in the middle: Germany’s DAX and MDAX are driven by (machinery and capital goods) exports to Asia. German and Swiss stocks and the Swiss franc belong to the Asian bloc, they rise with commodities and Chinese growth. The European periphery, however, loses relative competitiveness when Asia becomes stronger and oil prices and inflation increase, the fear of a U.S. recession augment. As a result, peripheral bond yields move upwards, the extreme was reached in the inflationary and potentially recessionary scenario in August 2011. Therefore, the periphery belongs to the American bloc; their bond yields decrease when the situation in the U.S. improves.
This explains also why a solution to the euro crisis is possible when investments in China and oil prices do not increase as quickly as in 2010/2011. For us, not Draghi but the potential unlimited bond buying contained in the OMT program saved the euro zone. But stronger U.S. house prices – thanks to QE3 – and weaker Chinese growth in combination with Italian or Spanish current account surpluses removed the stress on the financial markets.
A common error is to associate the AUD/USD exchange rate with stock markets and not with commodities. Despite the recent strong correlation during the Chinese growth since 2008, the weak Aussie during the dot-com bubble is the most prominent counter example, repeat in summer 2013.
Current weak levels of NOK/SEK, around 1.11, indicate that the American bloc has become a lot stronger than previously. Apart from some short periods, the NOK/SEK has never been at these levels since 2005, while during the dot com bubble the NOK/SEK was at 1.03.
Current account surpluses
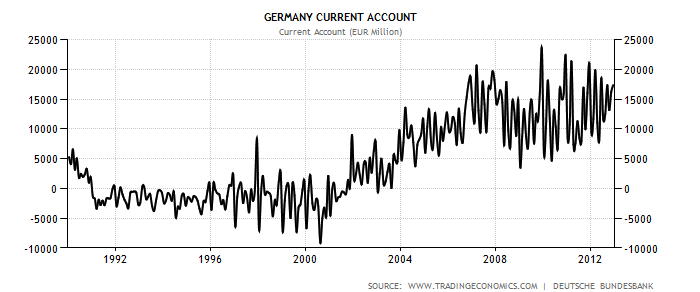
On the other side, a strong euro and CHF against the dollar, especially during weak markets, tell us that German and Swiss exporters and banks are still skeptic about the US growth.German exporters invest far less than in the early 2000s.
Due to the bad experience until the financial crisis, the banks that hold these huge funds do not pour the US trade deficit back in to the U.S. economy. They do not lend. Especially Germans prefer to prop up their balance sheets that is still full of toxic peripheral debt.
Situation in June 2013
Chinese expansion slowed down, European austerity reigns and the bust period of the credit cycle for 65% of the euro zone population has started: real estate prices in Southern Europe, but also in France and the Netherlands, are falling. Only Germany, Finland and Austria (together 35% of the euro zone population) are in a (perhaps ending) boom phase.
With a weakening China and strengthening of the United States, however, the shift from the Asian to the America bloc intensified, while weaker oil prices and lower spending have helped Italy and Spain achieve current account surpluses.
Thanks to low inflation and surpluses their government bonds and stocks are recovering, they oppose the bust trend. None the less, we judge that countries like France, Italy and Spain will follow Japan in a deflationary cycle, with weak spending but strengthening exports and stocks (see details).
See more for


1 comments
Domenico Laruccia
2013-03-16 at 18:01 (UTC 2) Link to this comment
what do you think about nikkej trading 8 times the S&P500 when average since 2003 is 10 times ? range is 6 to 14. Do you think this should come back to 10 or this average is not valid anymore, and why?