


George Dorgan
My articles My siteAbout meMy videosMy books
Follow on:LinkedINTwitterSeeking Alpha
CFA SocietyEconomicBlogs
In our chapter on purchasing power parity we explained why one should use the producer price index (PPI) instead of the consumer price index (CPI). The reason is that many CPI items like apartment rents or food prices do not matter to tradeable goods.
The following paper from the New York Fed written in 1995 provides insights why Real Effective Exchange rates and Purchasing Power Parity should use an export-price adjusted price index instead of the whole PPI that also contains goods locally sold .
It helps to explain why the yen was so strong against the dollar between 1990 and 1995, despite the bust in 1990/1991.

click to expand
Despite of the rising external position (an indicator of the financial account), Japanese current account surpluses were higher.
The result was a strongly improving yen despite weak GDP growth. Only with the upcoming US dollar carry trade from 1995 onwards, the yen depreciated again.
<–Back to overview of financial cycles
Coping with the Rising Yen: Japan’s Recent Export Experience

Thomas Klitgaard, published in 1995
Today: Vice President and Function Head
International Research Function, Federal Reserve Bank of New York
Coping with the Rising Yen: Japan’s Recent Export Experience
Despite an appreciating yen, Japanese firms have managed to maintain strong export sales growth during the first half of the 1990s. Their strategies? Cutting the yen price of exports and shifting production to higher-value merchandise.
As the yen strengthened against the dollar in the first half of the 1990s, many analysts expected that the Japanese trade surplus, and the trade tensions accompanying it, would diminish. A rising yen, they reasoned, would make Japanese exports less affordable abroad while making foreign goods more attractive to Japanese consumers.
Over time, the downward pressure on the demand for Japan’s goods would lead to a decline in the country’s trade surplus.Contrary to expectations, however, Japan’s merchandise trade surplus has shown few signs of shrinking. It rose from $52 billion in 1990 to a record $121 billion in 1994 and moderated only to $112 billion, at an annual rate, over the first three quarters of 1995.Although imports have helped bring the balance down,rising very rapidly in response to sharply lower import prices, this increase has not significantly narrowed the surplus because export growth has remained high. The surprising resilience of exports has prevented the exchange rate shifts of the first half of the 1990s from significantly reducing Japan’s trade surplus.This edition of Current Issues examines how Japanese exporters have been able to maintain much of their foreign market share in the face of an appreciating yen. One strategy has been to cut the yen price of exports to reduce the impact of the yen’s rise on the foreign price of these goods. A second strategy has been to shift production to high-value products. Because the demand for such products tends to be less sensitive to price increases, sales are partially insulated when the yen appreciates. For the most part, these efforts have allowed Japanese firms to enjoy strong export growth in the 1990s. The volume of exports has grown at an average rate of 5 percent a year in the first half of the decade,with producers of electrical machinery and chemicals faring particularly well.1
This export performance has roughly matched the export increases of Japan’s U.S.competitors despite the yen’s rise.Countering the Yen’s Rise The yen’s appreciation over the 1990s hurt the price competitiveness of Japanese exports in foreign markets. For example, from 1990 through the first three quarters of 1995, the value of the yen relative to the dollar rose by almost 40 percent.2 In other words, if the yen and dollar prices in the two countries had stayed unchanged, Japanese products in 1995 would be roughly 40 percent more expensive, compared with U.S. goods, than they were in 1990. How then did Japanese exporters respond to a development that could have had disastrous consequences? By slashing export prices and shifting production to high-value goods.
Lower Export Prices.Japanese firms sought to counter the yen’s rise by cutting their export prices in yen terms.3 Consequently, while U.S. export prices climbed by 8 percent between 1990 and the first three quarters of 1995, Japanese export prices in yen terms dropped by more than 20 percent.
Japanese firms sought to counter the yen’s rise by cutting their export prices in yen terms.
Chart 1 conveys the extent to which this strategy offset the yen’s appreciation. The relative price of Japanese exports is calculated as the yen price of those exports converted by the exchange rate into dollar terms divided by the price of U.S. exports. This relative export price measure declined by 15 percent from 1990 through the first three quarters of 1995. In other words, the dollar price of Japanese exports rose by 15 percent relative to the price of U.S. exports. Although this increase is significant, the loss of price competitiveness falls far short of that implied by the 40 percent appreciation of the yen-dollar exchange rate represented in Chart 1.Industries differed in how dramatically they lowered their export prices. From 1990 through the first three quarters of 1995, the most significant price declines occurred in electrical machinery (36 percent), chemicals (28 percent), textiles (25 percent), and metals(24 percent). More modest price cuts occurred in transportation equipment (10 percent) and industrial machinery (9 percent ).Japanese firms were assisted in their efforts to lower export prices by steep declines in the cost of imported materials. Imported oil and materials are usually priced in dollars, so a rise in the yen leads to a proportional decline in the prices of these goods in yen terms. Import prices fell by roughly 30 percent from 1990 through the first three quarters of 1995, and would have fallen further had the dollar price for commodities not jumped in recent years. The drop in import prices was particularly useful to producers of textiles, chemicals, and metals—goods that are relatively dependent on imported materials.Firms achieved the remaining reduction in export prices by lowering wages, cutting profit margins, and boosting productivity. These adjustments tend to be painful, reflecting the cost of maintaining export sales when the yen appreciates. Indeed, the stress placed on wages, employment, and profits by firms trying to maintain international competitiveness has worked to restrain Japan’s economic growth during the 1990s.((The profit-to-sales ratio for manufacturing firms fell from 5.2 in fiscal 1990 to 2.8 in fiscal 1994. The unemployment rate in Japan rose from 2.1 percent in 1990 to 3.2 percent in the third quarter of 1995.))
Significantly, the adjustments undertaken by Japanese firms to lower export prices did not lead to similarly sweeping declines in prices for goods sold on the domestic market. Domestic prices for industrial machinery and transportation equipment remained essentially unchanged from 1990 through the first three quarters of 1995, while prices for textiles, metals, and chemicals all dropped in the range of 5 to 10 percent.
During the same period, domestic prices for electrical machinery fell by 12 percent. These declines are much more modest than the cuts in export prices. Even producers of industrial machinery and transportation equipment, who took the least aggressive steps to maintain price competitiveness abroad, lowered their export prices relative to the prices they offered domestic customers. One interpretation of the price data is that Japanese consumers, by paying relatively high prices, indirectly helped Japanese firms maintain export growth during the yen’s rise. That is, the range of price cuts for exports would have been much more limited had Japanese firms been forced to offer matching cuts in domestic prices.The Shift to High-Value Products. To limit their vulnerability to a rising yen, Japanese exporters also shifted production from commodity-type goods to high-value products. The demand for commodities, such as textiles and metals, is quite sensitive to price changes because the goods themselves—whatever their country of origin—are largely indistinguishable, except by price. Customers, therefore, can easily switch to non-Japanese suppliers when a rise in the yen pushes the dollar price of Japanese exports higher. By contrast,more sophisticated, high-value products are less sensitive to price increases. For these goods, factors such as embedded advanced technology, high-quality standards, and other non price characteristics work to offset the impact on demand if prices are driven up by a stronger yen.
The shift to high-value products can be observed indirectly by comparing the behavior of Japan’s two export price indexes. One series, known as the unit value index, is a crude measure of the average price of exports, calculated by dividing the value of exports by the number of items shipped. The other series is a quality-adjusted, fixed-weight index that is part of Japan’s wholesale price index. The two export price measures diverge whenever the composition of exports changes. For example, suppose Japanese manufacturers leave the price of all autos unchanged but decide to ship more luxury cars and fewer economy cars. The unit value series rises because the price of an exported auto on average increases. The fixed-weight index,however, does not rise because the price of any particular auto is unchanged.
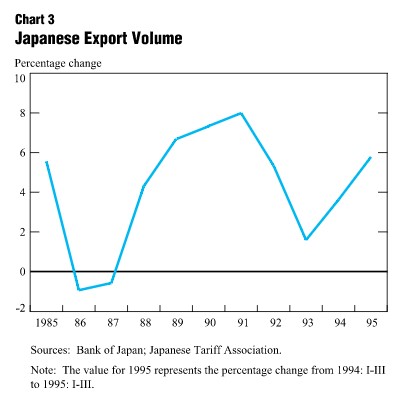
Starting in 1990, a large and widening gap developed between the two indexes, indicating a shift in the composition of Japanese exports to high-value products. From 1990 through the first three quarters of 1995, the average price of exports dropped by 8 per-cent, while the fixed-weight measure dropped by 22 percent (Chart 2). The quality-adjusted price for a fixed collection of goods fell sharply because Japanese exporters were lowering prices to offset the yen’s rise.Despite this decline, a move by Japanese firms in recent years to ship more expensive items kept the average price of exports from falling as steeply.4 So far,the process has shown no signs of slowing: the gap between the two export price series has widened each year since 1990.Chart 2 also offers insights into changes in firm behavior over time. In particular, it appears that the strategy of shifting to high-value products was not used as aggressively in the 1980s. The yen rose sharply after 1985, yet the two price indexes tracked each other closely, indicating that on average Japanese firms did not significantly alter the composition of their exports at that time to counter the yen’s rise.Japanese Export Performance. The cut in yen export prices and the shift to high-value products helped sustain Japanese export growth in the 1990s. Export volume grew at a 5 percent annual rate from 1990 through the first three quarters of 1995.However, the pattern of growth has not been uniform:sales to Western Europe fell in the early 1990s and then rose sharply in 1994-95. The European market is large enough that the 10 percent drop in sales to that region in 1993 had a substantial depressing impact on total Japanese exports (Chart 3). By the same token, the recovery in sales to Western Europe in 1994-95 gave a strong boost to total exports.
Performance by Industry
The two industries that most aggressively pursued the two strategies to offset the yen’s rise—electrical machinery and chemicals—saw their export volumes grow at an average rate of 11 percent from 1990 through the first three quarters of 1995 (see table).5 The other major industry groups saw their exports grow at much slower rates. Those that managed only modest shifts in production—metals and textiles—grew at average annual rates of 4 percent and 0 percent, respectively. Those that offered the smallest price discounts—industrial machinery and transportation equipment—grew by 3 percent and fell by 2 per-cent, respectively.6 Growth vis-à-vis the United States.Japanese exporters have coped well enough with the rising yen to match the performance of U.S. exporters in selling to Asia and fall only slightly short of their U.S. competitors in selling to Western Europe. Asia has been a rapidly expanding market, with the volume of exports from
Japanese exporters have coped well enough with the rising yen to match the performance of U.S. exporters in selling to Asia and fall only slightly short of their U.S. competitors in selling to Western Europe. Japan and the United States to that region rising at an average rate of 11 percent per year from 1990 through the first three quarters of 1995.((U.S. export volumes are calculated by dividing nominal dollar exports, on a census basis, by the export price index compiled by the Bureau of Labor Statistics.)) Neither country enjoyed much growth in its exports to Western Europe: from 1990 through the first three quarters of 1995, U.S.exports increased at an average annual rate of 1 percent,while Japan’s exports fell at an average annual rate of 1 percent. However, a revival in Western European demand beginning in 1994 generated a roughly equal boost to both countries’ exports to that region.
Conclusion
Japanese exporters employed two strategies to cope with the rising yen in the first half of the 1990s: they cut yen export prices to minimize the changes in the dollar price of their goods and they shifted production to high-value products, which tend to be relatively less sensitive to price increases than commodity-type products. These initiatives have largely enabled Japanese firms to sustain export growth. The only significant export weakness, in 1992-93, stemmed from a drop in sales to Western Europe, but exports to that market have since rebounded. One important indication of the adaptability of Japanese exporters is that, despite the yen’s appreciation, U.S. firms at best have made only modest market share gains in Asia and Western Europe at the expense of their Japanese competitors. The resilience of exports has kept Japan’s trade sur-plus near its record high. Because exports far exceed imports, Japanese imports must grow significantly faster than exports for the trade surplus to decline.Recent history illustrates this point. In 1994, the dollar value of Japanese exports grew by 10 percent while imports grew by 14 percent, yet the surplus remained unchanged at $120 billion. In the first three quarters of 1995, the surplus dropped only modestly, to $112 bil-lion, even though imports surged by 25 percent over year-ago levels. It was the strength of exports, up15 percent over this period, that prevented the surplus from shrinking more dramatically. These examples show that Japan will find it difficult to reduce its trade surplus significantly as long as Japanese firms can sustain export sales by pursuing strategies that offset the strong yenReferences
Gagnon, Joseph, and Michael Knetter. 1995. “Markup Adjustmentand Exchange Rate Fluctuations: Evidence from Panel Data onAutomobile Exports.” Journal of International Money and Finance 14,no. 2: 289-310.Krugman, Paul. 1987. “Pricing to Market When the Exchange RateChanges.”
S.W. Arndt and J.D. Richardson, eds., Real-Financial Linkages Among Open Economies. Cambridge: MIT Press.
Lowell, Julia, and Loren Yager. 1993. “Pricing and Markets: U.S.and Japanese Responses to Currency Fluctuation.” Center for Asia-Pacific Policy, RAND Working Paper.
Mann, Catherine. 1986. “Prices, Profit Margins, and ExchangeRates.” Federal Reserve Bulletin 72: 366-79 (June).
Marston, Richard. 1990. “Pricing to Market in Japanese Manufac-turing.” Journal of International Economics 29: 217-36(November).About the AuthorThomas Klitgaard is a Senior Economist in the International Macroeconomics Function of the Research and Market Analysis Group.The views expressed in this article are those of the author and do not necessarily reflect the position ofthe Federal Reserve Bank of New York or the Federal Reserve System
- Export volumes are calculated by dividing nominal yen exports,on a customs clearance basis, by the corresponding export price component of the wholesale price index. In dollar terms, total Japanese exports grew at an average annual rate of 9 percent from 1990 through the first three quarters of 1995. [↩]
- In 1990, the dollar was equivalent to 138 yen. During the first three quarters of 1995, it averaged 92 yen. [↩]
- Mann (1986) and Krugman (1987) were among the first to study reports that exporters cut prices to maintain foreign sales. Recent work includes Gagnon and Knetter (1995). [↩]
- One example is the shift to luxury cars.
 Nissan and Toyota introduced their Lexus and Infiniti lines, respectively, in 1989. The cars currently equal 25 percent of the autos exported to the United States by both companies. [↩]
 - Most Japanese exports fall into three categories: electrical machinery (25 percent of exports in 1994), industrial machinery(24 percent), and transportation equipment (23 percent). The other major categories are chemicals (6 percent), metals (6 percent), and textiles (2 percent). Miscellaneous products make up the remaining 14 percent of Japanese exports. [↩]
- Export sales of transportation equipment have been restrained by the increased production of Japanese automotive plants operating in North America and Europe. For example, the number of automobiles produced by Japanese plants operating in the United States increased by 33 percent from 1990-94. [↩]


