


George Dorgan
My articles My siteAbout meMy videosMy books
Follow on:LinkedINTwitterSeeking Alpha
CFA SocietyEconomicBlogs
The following table gives an overview among different CPI baskets in the world.
CPI Baskets China Russia Italy United States
Germany Switzerland
Food, non-alc. drinks 31.8 31.0 17.2 8.2 10.3 10.5
Alcohol, tobacco 3.5 5.9 3.1 1.8 3.9 1.8
Clothing, Footware 8.5 9.6 9.5 3.4 4.9 3.8
Actual Rentals for Housing 17.2 (incl. housing energy) 4.0 2.5 7.4 21 19.0
Imputed Rentals for Housing N.A. N.A. 25.1 N.A. N.A.
Housing Energy and other expenses 15.2 8.2 5.5 10.7 5.7
Furnishing & Household Appliances 5.6 6.0 8.5 4.3 5.6 4.5
Health care 9.6 4.0 3.8 7.6 4.0 15.0
Transportation 10.0 13.8 16.1 16.4 13.2 11.6
Communication (incl. in transportation) 2.9 3.8 3.1 2.7
Recreation & cultural 13.8 6.6 6.6 5.8 11.6 10.2
Education (incl. in recreation & cultural) 1.4 1.2 3.2 0.7 0.9
Restaurant, Hotel (incl. in recreation & cultural) 2.9 12.0 5.7 4.4 8.5
Miscelleanous 6.1 8.5 8.5 7.4 5.6
Total 100 100 100 100
Swiss and US data from summer 2014, remaining countries from summer 2012
Differences among CountriesOwner-Occupied Housing The measurements for the euro zone, Italy, Germany and Switzerland do not include owner-occupied rent: Hence the “housing” weight in Italy are low because most Italians own their own home, while Germans or Swiss rather rent. The basket of other countries (incl. Sweden) contains owner-occupied rent. Food Typically poorer countries have a basket with a higher weight for food. When these countries get richtthe part of food decreases. The real Chinese CPI basket effectively contains 31.8% food, but the Swiss basket has only about 11.0% in this category and the Americans even only 8%. |
 Typically poorer countries have a basket with a higher weight for food and other consumption goods, but richer states give them a smaller weight. Here the full details over different countries - Click to enlarge |
Changes in the U.S. BasketIn the year 1939 the US basket contained 35% food, today it is around 15% – when restaurants are included. Between 1939 and 1984 the importance of transportation in the U.S. basket increased from 8 to 24%. After that it slowed to 17% today again. Recently the importance of the food category has risen again; reasons are higher global food prices and health awareness. The Japanese, for example, spend 2.2% of their income on fish and seafood (vs. US 0.3%) and 3.7% on fruit and vegetables (vs. US 1.3%). |
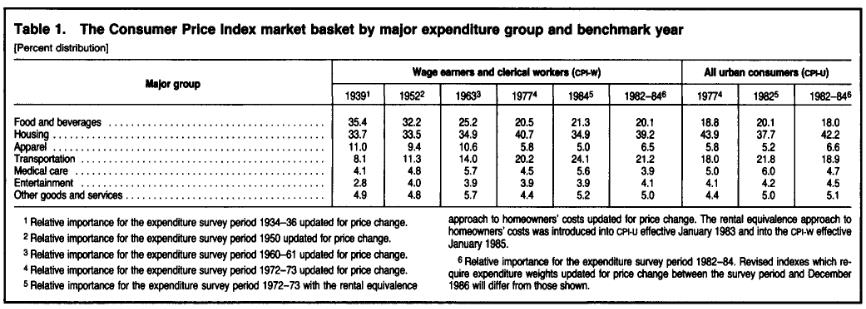 source BLS source BLS |
1980s: Basket Adjustment away from Transportation and Food Towards Durables and ServicesIn the 1970s rising food and transportation costs were one driver of the inflationary period. Still in 1984 these two categories took 45.5% of U.S. basket, compared to 25% today. In the 1980s and 1990s the consumer price baskets were re-adjusted from the previously quickly rising food and energy prices towards durable goods and services. This was one of the reasons why bond yields receded (see also the 1990s). |
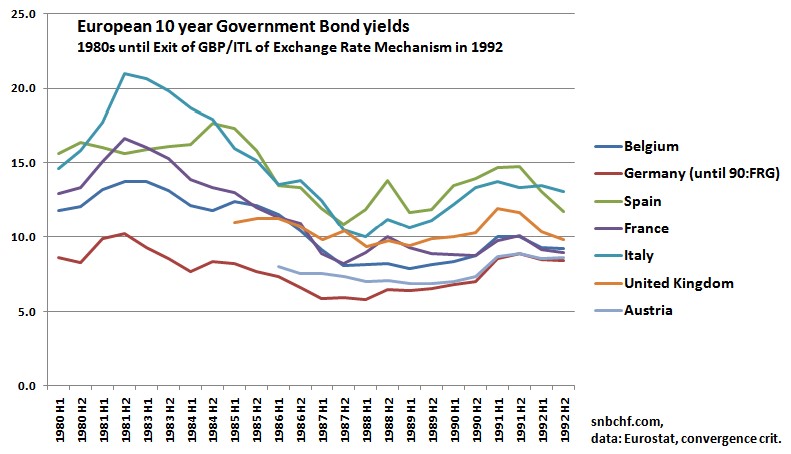 Falling Bond yields in the 1980s |
2000s: Basket Adjustments Away from Durables towards ServicesSince the early 2000 durable goods continue to fall in price, while prices of services are rising. People are spending more for services out of the their total income.
|
 Click to enlarge. |
This slowly triggers an adjustment of the CPI basket towards services. Housing is also considered a service.
The durables like vehicles, clothes or household appliances lose their share.
| United States CPI basket | Weight in 2001 | Weight in 2015 |
| Purchase of vehicles | 6.5% | 5.2% |
| Clothing and Footwear | 4.2% | 3.4% |
| Furnishing, Household equipment | 3.7% | 3.3% |
| Housing | 30.1% | 32.7% |
| Services less Housing | 30.1% | 31.4% |
—————————————
Back to purchasing power parity.
Read also:
In China, the Consumer Price Index (“CPI”) is becoming more and more of a joke. What’s in China’s CPI Basket? Seeking Alpha in 2011


