
Read More »


 On Swiss National Bank Main SNB Background Info


 Geld verdienen im Internet: Easy Money?
5 May 2024
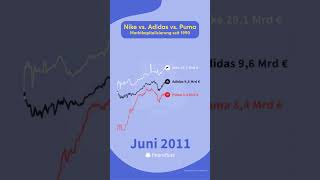 Nike vs. Adidas vs. Puma #nike #adidas #puma
5 May 2024
 6 Indizien, dass du finanziell überdurchschnittlich bist! (oder es bald sein wirst)
5 May 2024
 Überall Krieg: Fallen bald Bomben auf Deutschland?
5 May 2024
 YOLANDA DIAZ VUELVE A MENTIR CON LOS FIJOS DISCONTINUOS
5 May 2024
 2oz Silver Werewolf
4 May 2024
 Nuestras Canciones Favoritas de The Beatles (ft. Daniel Ramírez)
4 May 2024
 El EURO como Alternativa al DÓLAR
4 May 2024
 Der vermutlich reichste Gefängnisinsasse der USA. 🇺🇸 #binance
4 May 2024
 Óscar Puente ACUSA, Milei le RESPONDE
4 May 2024
 Vermeide diese 4 Fehler bei der Reiseplanung #shorts
4 May 2024
 NZDUSD buyers took their shot above 200 day MA/50% retracement and missed
3 May 2024
 “Gold ist Geld, Alles Andere Kredit!”
3 May 2024
 Fed Obfuscates on Inflation While Politicians Scapegoat Businesses
3 May 2024
 The price of Bitcoin falls to 50% of 2024 this week & bounces. Price back above 100 day MA
3 May 2024
 EURUSD sets technical levels in the ups and downs after the US jobs report.
3 May 2024
 Kriegswirtschaft & Inflation | Ernst Wolff Aktuell
3 May 2024
 AUDUSD runs higher after US jobs report but stalls at a key ceiling.What next technically?
3 May 2024
 Im Alltag Geld sparen: 6 einfache Tipps, die viele übersehen
3 May 2024
 ¿DEBEMOS PREPARARNOS Para una Guerra Mundial?
3 May 2024