


2026-04-09
Articles by D.W. MacKenzie
2026-03-09
How can the US avoid National Bankruptcy?
Cutting welfare rolls and reducing government employment in welfare and regulatory bureaucracies alone wont balance the Federal budget.
Read More »2025-08-13
Is Increased Inflation Due to Increased Tariffs?
People dislike inflation, and with good cause. However, we should not use price inflation as a cudgel to beat up our political opponents.
Read More »2025-07-16
Is New York City Doomed?
There are real concerns regarding Mamdani. Mamdani is a self-described socialist, and socialism has failed disastrously everywhere it’s been tried.
Read More »2025-07-15
Is New York City Doomed?
There are real concerns regarding Mamdani. Mamdani is a self-described socialist, and socialism has failed disastrously everywhere it’s been tried.
Read More »2024-11-05
Unemployment in the Biden & Trump Economies
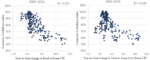
Both the current President and his predecessor claim credit for low unemployment. To what extent are recent lows in unemployment rates due to the policies of these two Presidents’ policies?There are several causes of low unemployment. First, reducing minimum wage rates lowers unemployment, mostly for teens. Higher minimum wage rates correlate with higher unemployment rates (see the next graph). The real purchasing power of the current $7.25 minimum wage is nearly at an all-time low (see the second graph below). Inflation has devalued the real minimum wage, especially in the past few years. Also, Congress hasn’t raised the money rate of the Federal minimum wage in many years. Unemployment rates have risen since April 2023, but so have some state minimum wage rates. We should
Read More »2024-09-30
Overtime Tax Exemption: Pros and Cons
Former President Trump has proposed exempting overtime income from taxation. Is this a good idea? Some economists may point out that exempting overtime hours from taxation targets marginal labor supply. Increasing marginal take home pay from taxes encourages work, can increase aggregate supply and economic growth.Other economists may point out that overtime hours are highly cyclical; tax revenue from overtime hours rises during economic booms and falls during recessions. What this means is that exempting overtime hours from taxation automatically increases budget deficits leading into a recession, and automatically decreases budget deficits going into an economic boom. Economists who still cling to the Demand Side theory of John Maynard Keynes refer to this as an “automatic
Read More »2024-09-17
Price Inflation Is Not a “Global Phenomenon”
The Economics Policy Institute (EPI) has promoted a myth that recent price inflation is a “global phenomenon,” is not caused by domestic economic policies. An EPI study claims “that high [price] inflation in the U.S. has not been driven by any unique American policy—not the American Rescue Plan and other generous fiscal relief during the pandemic recession and recovery nor anything else U.S.-centric”. It doesn’t logically follow that something that we observe in most or all nations can’t be due to domestic policies in each of these nations. It is quite possible for nations to emulate each other’s domestic policies, and to each experience very similar results.The EPI and their allies focus on “generous fiscal policy” as a false cause of price inflation to divert attention from the true
Read More »2024-09-05
Who Caused the Recent Wave of Inflation?
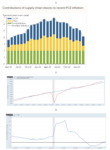
A study from The Federal Reserve Bank of San Francisco claims that most of the price inflation that plagued the US economy over the past few years was due to global supply chain disruptions, due to the Covid-19 pandemic. Is this a valid study, or an attempt by the Fed to evade responsibility for our recent economic troubles?There are several problems with this study. First, this study aims at establishing a correlation between supply chain disruptions and “above trend” price-inflation rates. The two-percent trend used in this study is actually just the minimum rate of inflation that the Fed has targeted deliberately since 1996. It is disingenuous for the Fed to treat the two-percent minimum inflation rate that it chose as a “trend,” for which it lacks responsibility.Fed officials could
Read More »
Food Price Controls are a Losing Issue
The central problem with government economic policies is that many bad economic policies are politically advantageous. Hence, politicians enact policies that many of them know don’t work just to stay in power. Price controls are bad economic policy. Democrat Presidential candidate Kamala Harris wants to empower the Federal Trade Commission to stop “food price gouging” with what would amount to price ceilings.Price ceilings cause shortages of goods and wasteful queuing, in this case for food. Why might such a bad policy win Harris, or any candidate, votes? First, many people don’t understand economics, don’t understand why price controls are bad policy. Second, a majority or people want government to secure a supply of affordable food. Consequently, increases in food costs in recent years
Read More »2024-08-21
Greedflation and Debtflation are Nonsense
Popular discussions of inflation and the economy have produced more heat than light, if not heat and darkness. President Biden has made multiple remarks on his record, which taken singly are each incorrect. Taken together, Biden’s remarks on Bidenomics are incoherent.Biden claims that his main fiscal stimulus policy, the American Recovery Plan delivered record reductions in unemployment without causing inflation. Biden has insisted that corporate greed (Greedflation) caused the recent wave of price inflation. Biden also claims credit for deficit reduction. There is little evidence of fiscal stimulus working, ever. There is a theory in economics according to which larger fiscal deficits increase total spending, and this increases economic activity and reduces unemployment rates- provided
Read More »2024-08-01
Bidenomics: Proposed myths & vexing facts
President Biden and his supporters claim that he took an economy that was “flat on its back” in 2021 and made it “the envy of the world”. How did Biden accomplish this? He supposedly rebuilt the economy “from the middle out and the bottom up”.The data on economic conditions in the US economy over the past few years are clear. First, unemployment rates have been relatively low. However, the unemployment rate during the Covid crisis peaked at 14.8% in April 2020, and had fallen to 6.1% by the time Biden signed his America Rescue Plan (ARP) in March of 2021. Economists doubt the effectiveness of fiscal stimulus policies even when they are properly timed. The ARP supplied far too much fiscal stimulus far too late, at best. At worst, ARP delivered a dangerous increase in the US national debt,
Read More »2024-07-25
Reich vs Reality: Free Markets Work Best
Robert Reich recently asserted that “free markets” aren’t neutral or free, are actually shaped by those who wield power. Reich believes that government powers have been subverted by private interests- this part of his analysis is actually true in many cases. Reich hopes for some sort of miracle whereby countervailing government powers will work in the public interest to suppress greedy monopolists- this part of his analysis is delusional and dangerous.Reich ignores the reality that governmental involvement in the economy of each nation varies. Some countries, like North Korea, have government run economies. Other nations, like Taiwan and Ireland, have far less governmental involvement in their economies. Scholars in several think tanks have estimated the degree of economic
Read More »2024-07-04
The SCOTUS Chevron Decision: Pros and Cons
Many people who appreciate free markets are hailing the recent Chevron decision. Striking down Chevron curtails the powers of many officials in regulatory agencies, but how does this really affect entrepreneurs and markets? There are two important things to note here. First, striking down Chevron didn’t remove any regulations from US industry, this ruling transferred powers to interpret regulatory rules. Second, there are two sides to regulatory capture.Former lobbyist Jack Abramoff has pointed out that entrepreneurs lobby for two reasons. Sometimes entrepreneurs’ lobby regulatory agencies to gain an advantage over rivals. Other times entrepreneurs lobby regulatory agencies just to be left alone. Most entrepreneurs engage in regulatory capture to protect their
Read More »2024-06-13
The Latest BLS Unemployment Report, More Signs of Recession
What is the Mises Institute?
The Mises Institute is a non-profit organization that exists to promote teaching and research in the Austrian School of economics, individual freedom, honest history, and international peace, in the tradition of Ludwig von Mises and Murray N. Rothbard. Non-political, non-partisan, and non-PC, we advocate a radical shift in the intellectual climate, away from statism and toward a private property order. We believe that our foundational ideas are of permanent value, and oppose all efforts at compromise, sellout, and amalgamation of these ideas with fashionable political, cultural, and social doctrines inimical to their spirit.
Read More »2024-06-11
Robert Reich is Wrong, and Dangerous
Robert Reich has embarked on an intellectual journey- he intends to debunk 10 economic myths. The first of these 10 supposed myths is the idea that economics is a value free objective science. Reich offers a brief history lesson, in which he describes how Adam Smith developed economics as a branch of moral philosophy. Patrick Carroll has pointed out that Reich’s argument entails a fallacious appeal to tradition.
Read More »2024-05-17
Brad Delong is Totally Wrong about Inflation & Fed Policy
Economist Brad Delong believes that the US economy is in the midst of a soft landing, and that the Federal Reserve should have started cutting interest rates in January. Delong fears that the Federal Reserve “might upend America’s soft economic landing” if it doesn’t begin cutting interest rates soon.DeLong points out that core CPI (omitting food and energy prices) has fallen recently; it’s lower than it was a year ago. There are several problems with DeLong’s reasoning. First, the Federal Reserve doesn’t base its’ policy on the core CPI measure of inflation. The Fed pays close attention to the PCE measure of inflation. Why? The CPI tracks prices for a fixed set of goods. PCE inflation rates adjust for changes in what we buy- people tend to substitute cheaper goods for
Read More »2024-05-16
Both of Biden’s Key Economic Advisers get Basic Econ Wrong
The Secretary of the Treasury and the Chair of the Council of Economic Advisers are the two principal economic advisors for any president. President Biden chose Janet Yellen as Secretary of the Treasury and Jared Bernstein as the Chair of his Council of Economic Advisers.Stephanie Kelton asked Bernstein a basic question about Biden’s monetary and fiscal policies. Bernstein responded with a shocking statement.“The US government can’t go bankrupt because we can print our own money”The idea that the government can print its way out of any fiscal deficit is a path to the dark side of hyperinflation. Bernstein apparently embraces Modern Monetary Theory, a crackpot theory that no serious economist embraces. Kelton then asked Bernstein to explain why any government would borrow in a currency that
Read More »2024-04-17
Is Anyone Smart Enough to use Inflation & the Public Debt to Manage the Economy?
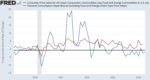
Last week I posted something on how business confidence affects capital investment. Many factors may affect business confidence. The psychological mindset of business owners might change on its own. Public policies may affect business confidence too. Scholars at the University of Chicago developed an economic policy uncertainty index, which estimates our felt ambiguity regarding public policies1. The next graph depicts lagged effects of year over year changes in policy uncertainty on year on year changes in gross private domestic investment.As one might expect, higher levels of policy uncertainty correlate with lower levels of private investment (by 27%). Economic theory posits that fiscal and monetary policies work best when the public doesn’t know what to expect next.
Read More »2024-04-04
US Job Growth is Slower than Reported
The news media has been reporting steady job growth in the US economy since the Covid 19 crisis. Employment has grown steadily. However, data on employment represents progress in the number of jobs filled. The total number of jobs in business plans is the sum of all filled and unfilled jobs, total employees plus total job openings (see the red line in the top-left graph below).The total number of jobs in the US economy increased rapidly up to March 2022. Total filled and unfilled jobs have fluctuated since March 2022, with little increase. Why have businesses been planning for relatively few new jobs? It appears that low businesses confidence has put a damper on business plans to create additional jobs. Growth of fixed nonresidential fixed investment peaked in the second
Read More »2024-04-03
California’s Minimum Wage Increase is Inefficient and Unfair
California raised its minimum wage rate for the fast food industry to 20$ today. US Politicians haven’t targeted specific industries with minimum wage increases since the Great Depression. There are already signs that some fast food places in California are cutting back on employment. The specific effects of this fast food minimum wage will become clear during the rest of this year. For the time being, we should recall the general effects of minimum wages.Minimum wage laws reduce employer demand and increase labor supply; this causes higher unemployment rates. Minimum wage laws affect teen workers more than adult workers because teens are less skilled, less educated, and less reliable. The below left graph depicts the relationship between minimum wages and overall
Read More »2024-03-05
The New Manhattan Toll Rates: Efficient Policy, or Just Another Boondoggle?
The Metropolitan Transportation Authority in New York (MTA) has announced a set of tolls for vehicles on streets south of Central Park.Passenger vehicles: $15Small trucks: $24Large trucks: $36Motorcycles: $7.50Taxi drivers: $1.25 per rideUber, Lyft, other ride-shares: $2.50 per rideThe economic reasoning for charging tolls in Manhattan is simple; open access to the roads of Manhattan leads to a Tragedy of the Commons. The ability of everyone to use streets at zero money price leads to overuse and under-maintenance of these roads. Overuse of city roads causes traffic congestion, wastes gas and time, and increases pollution. In other words, open access roads are similar to public goods- once built roads are free to everyone and the use of any road by one person deprives no
Read More »2024-03-04
The Folly of Federal Reserve Stabilization Policy: Part II 1985-2023
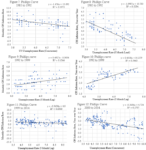
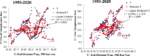
Many economists think the Federal Reserve can use Phillips Curve tradeoffs between inflation and unemployment to guide Fed macro stabilization policy. Inflationary Fed policies may act as a monetary stimulus, to regulate unemployment. Data from 1948 to 1985 indicates that the Phillips Curve doesn’t actually exist. Does the data since 1985 reveal stable Phillips Curve tradeoffs- estimates of the effects of inflation on unemployment that may guide future policies?Monthly inflation data from 1985 to 1992 correlates with unemployment concurrently at a rate of 20% (see figure 7 below). Year over year inflation data from 1985 to 1992 correlates with unemployment at a rate of 52% (see figure 8). The estimate in figure 8 assumes that unemployment rates lead by three months- but the
Read More »2024-03-01
The Folly of Federal Reserve Stabilization Policy: Part I 1948-1985
The Federal Reserve Board is responsible for formulating macro stabilization policy. More specifically, the Federal Reserve Board seeks tradeoffs between inflation and unemployment rates. Fed officials need meaningful data to formulate useful policies.
Read More » On Swiss National Bank
-

SNB Sight Deposits: decreased by 2.2 billion francs compared to the previous week
-

Household wealth in 2025
-
Heads up for NZD and CHF traders, RBNZ Gov Breman and SNB Chair Schlegel to speak
-
Swiss franc appreciation has led to tighter monetary conditions – SNB minutes
-
SNB’s Chairman Schlegel: A few months of negative inflation wouldn’t be a problem
Main SNB Background Info

Featured and recent
-
 SNB Sight Deposits: decreased by 2.2 billion francs compared to the previous week
 -
 Corrections vs. Bear Markets: Why 20% Declines Are Obsolete
 -
 -40 Kilo! Ricarda Lang feiert Abnehmerfolg! Das Internet feiert!
 -
 Steuerrecht digitalisieren mit KI – eine gute Idee?
 -
 Why Switzerland is launching a charm offensive in Southeast Asia
 -
 Ex-Raiffeisen bank CEO fined for tax evasion
 -
 The price of gold matters, but availability matters more.
 -
 FATAL: EU Chefdiplomatin blamiert ganz Europa! China außer sich!
 -
 India’s situation shows why physical gold is different from paper exposure.
 -
 ZUGRIFF auf dein Vermögen: So schützen sich INSIDER