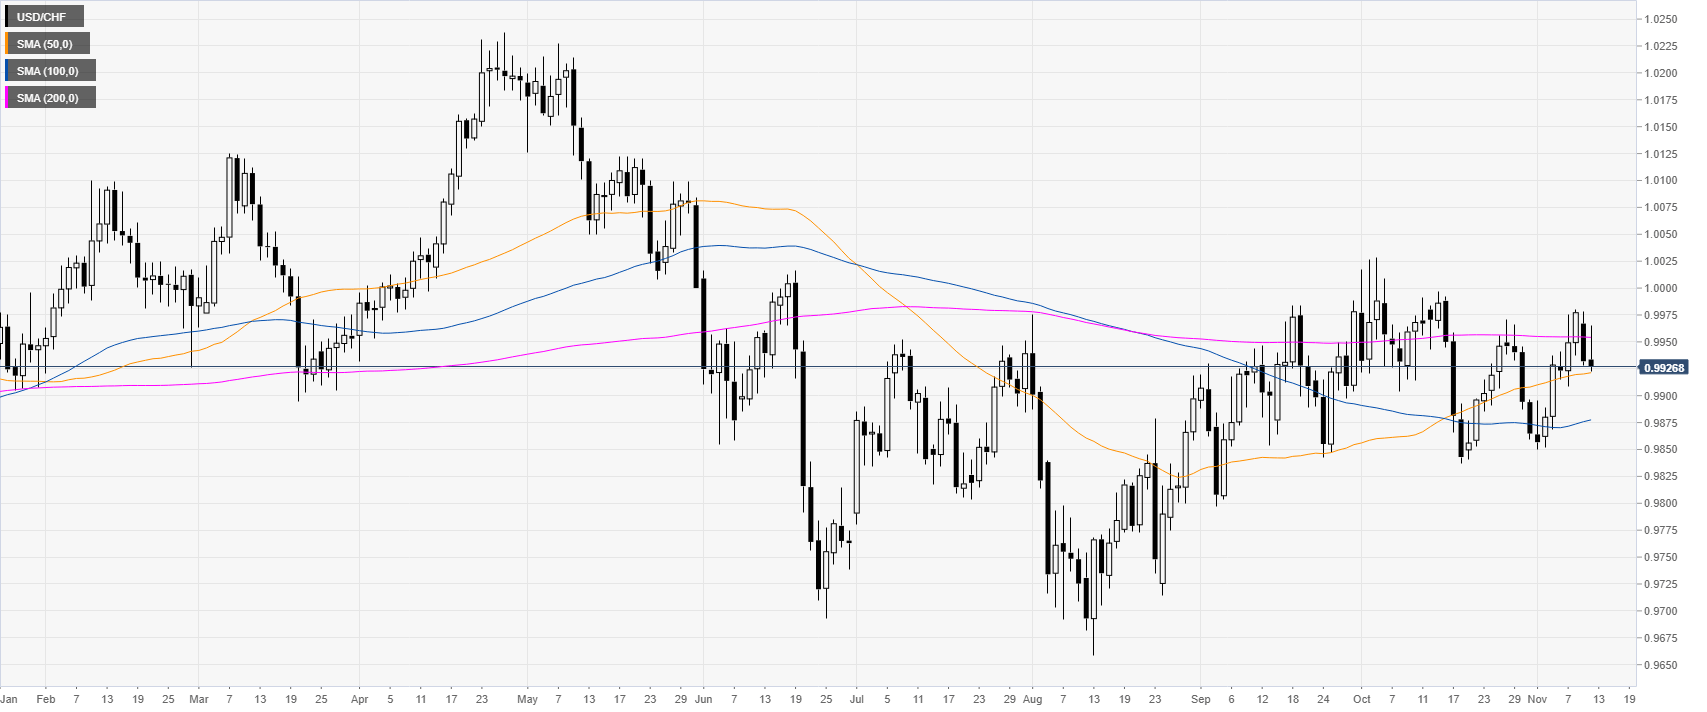
USD/CHF daily chartOn the daily chart, USD/CHF is trading in a range below its 200-day simple moving average (DMA). The spot is holding just above the 50 SMA today at the 0.9921 level. |
USD/CHF daily chart(see more posts on USD/CHF, ) |
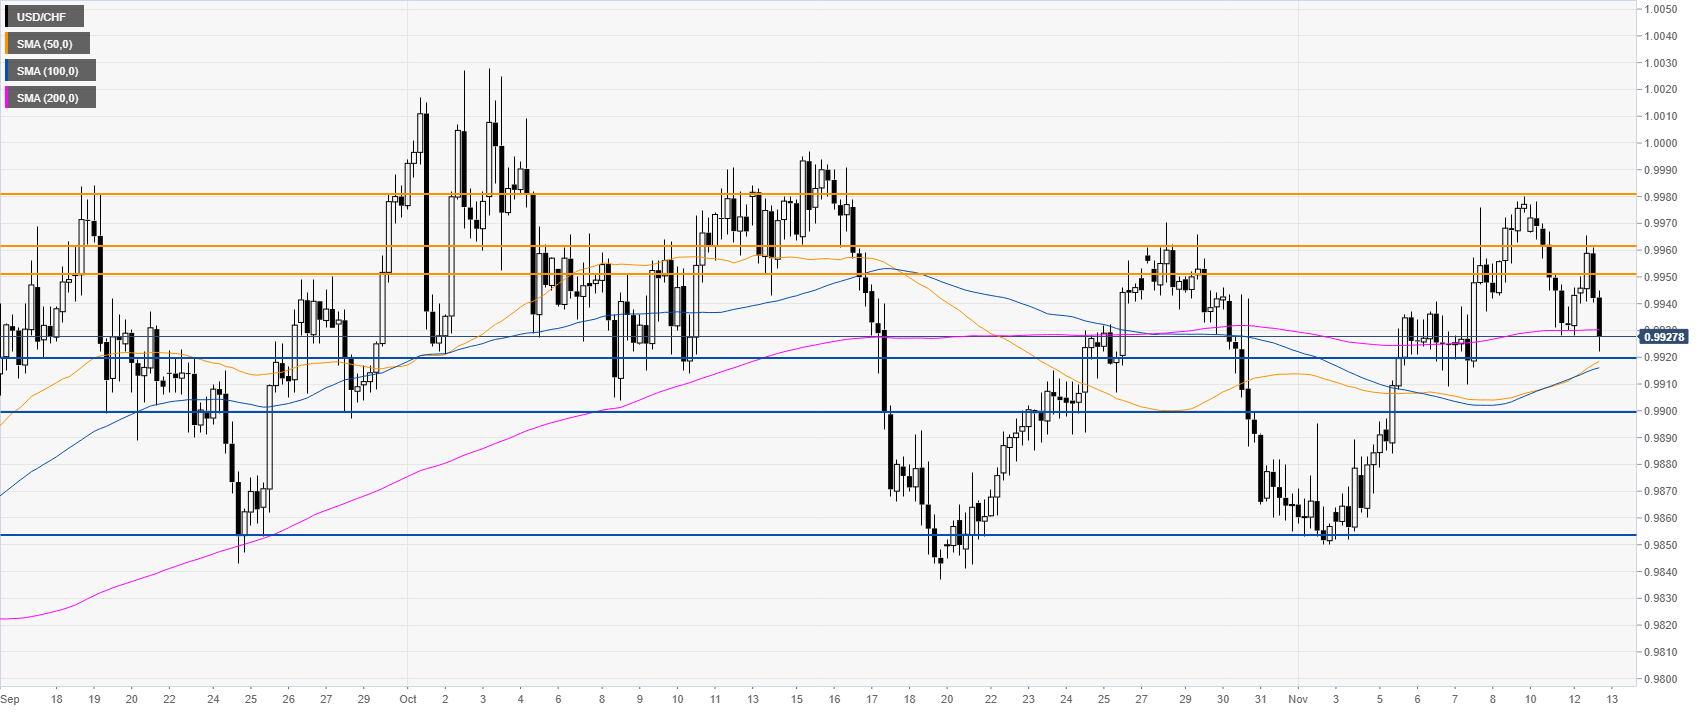
USD/CHF four-hour chartUSD/CHF is retracing down from the current November highs while challenging the 0.9920 level and 200 SMA. If the buyers give up, the spot can continue to decline towards the 0.9899 and 0.9855 support levels, according to the Technical Confluences Indicator. |
USD/CHF four-hour chart(see more posts on USD/CHF, ) |
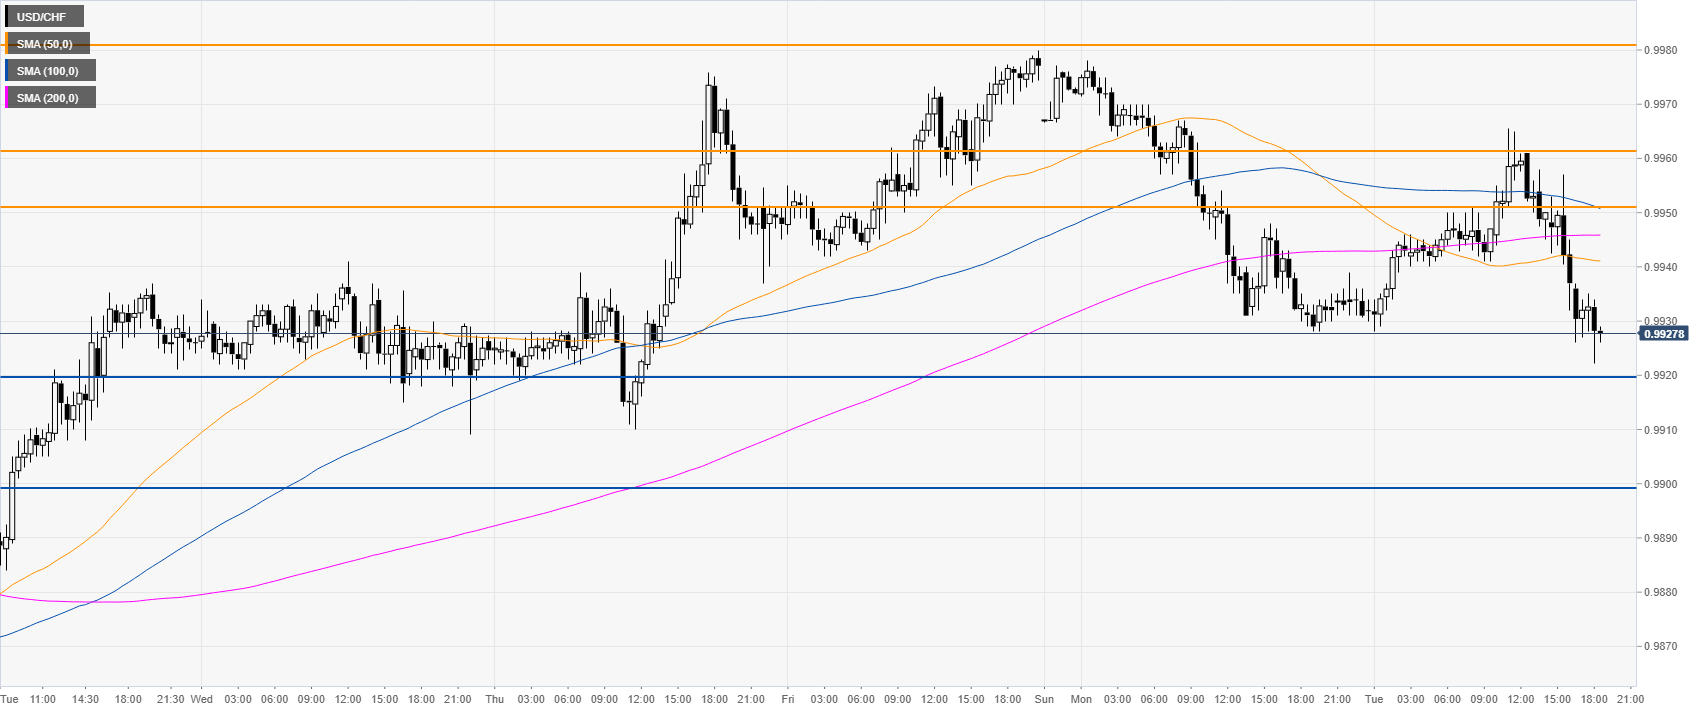
USD/CHF 30-minute chartUSD/CHF is trading below the main SMAs, suggesting a bearish bias in the short term. Resistance can be found near the 0.9951/61 zone and the 0.9982 level, according to the Technical Confluences Indicator. |
USD/CHF 30-minute chart(see more posts on USD/CHF, ) |
Full story here Are you the author? Previous post See more for Next post
Tags: newsletter,USD/CHF


