Which Disturbance in the Farce can be Profitably Ignored Today?There has been some talk about submerging market turmoil recently and the term “contagion” has seen an unexpected revival in popularity – on Friday that is, which is an eternity ago. As we have pointed out previously, the action is no longer in line with the “synchronized global expansion” narrative, which means with respect to Wall Street that it is best ignored. |
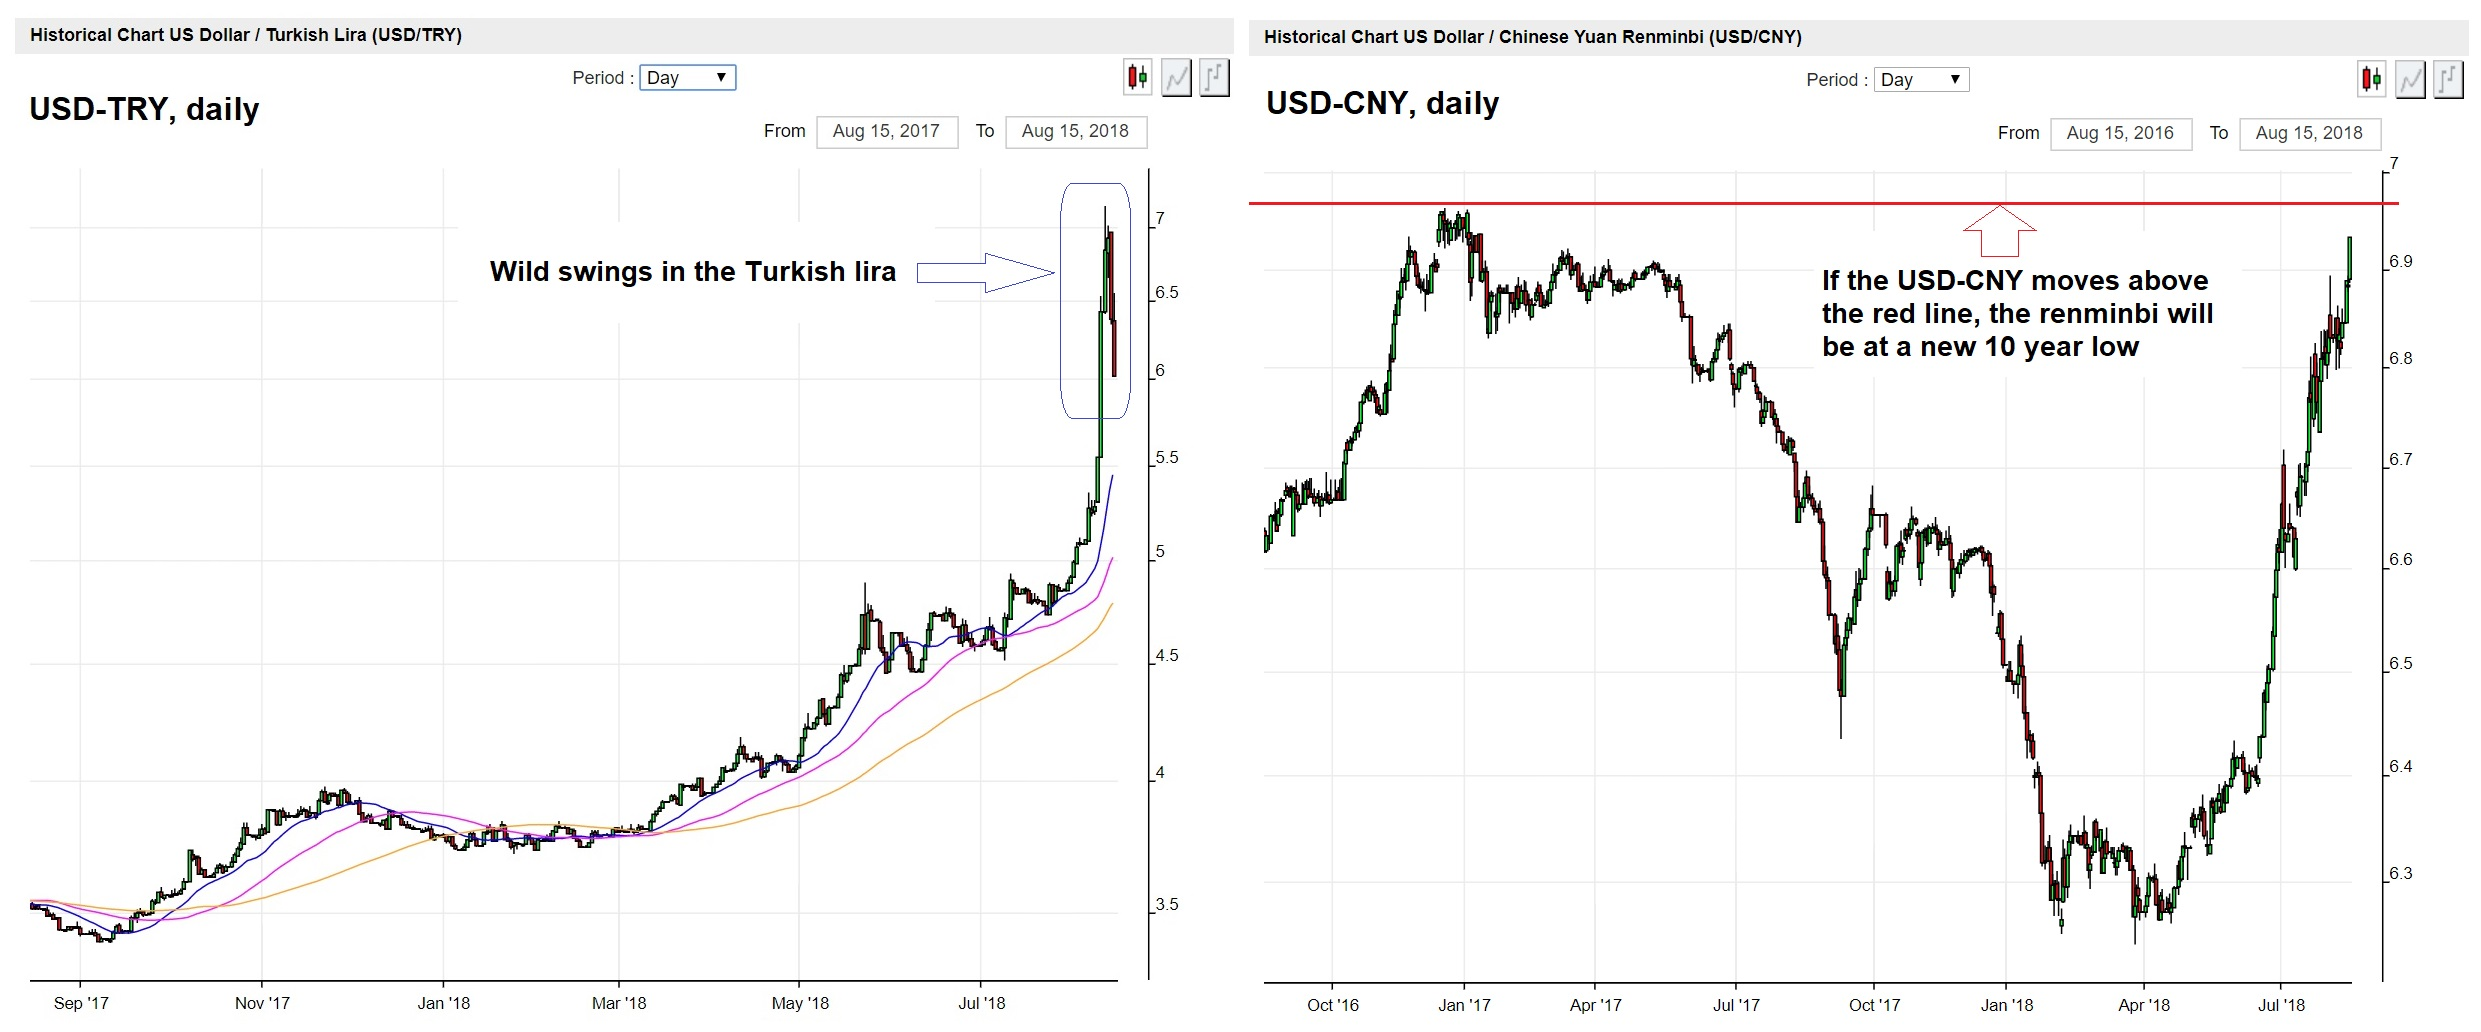
Misbehaving EM currencies, 2016-2018Misbehaving EM currencies – the Turkish lira has become quite unruly of late, which is bad juju for a country with a huge balance of payments deficit and an external debt-to-GDP ratio of well above 50%. Arguably the zaftige move in the Chinese yuan is the more important event though. If it breaches the red resistance line in the chart above, the yuan will be at a new 10-year low. Oh well, who cares? Not the US stock market if recent headlines are any indication. |
Last week we documented the extreme complacency that currently prevails among market participants (see “Stock Market Manias of the Past vs the Echo Bubble” for the details). Wall Street’s nonchalant disdain for the growing consternation in the submerging markets arena is illustrated further by a few headlines we have come across just yesterday and today (this is by no means a complete list):
Barrons.com • Tue 3:15 PM, Morning Movers:
Dow Rallies as Earnings Put Turkey Out of Mind
Barrons.com • Tue 7:44 PM, Intraday Update:
Dow Climbs as Markets Close Eyes to Turkey
CNBC • Tue 2:50 PM
Pros take most bullish position on US stocks in 3 years amid ‘peak profits, policy and returns’
CNBC • Tue 2:50 PM
Investors haven’t been this bullish on US stocks since January 2015
Ino.com • Tue 10:00 AM
Now May Be The Time To Buy A FANG ETF
Marketwatch • Wed 11:26 AM
The market is so good that Trump can’t mess it up
|
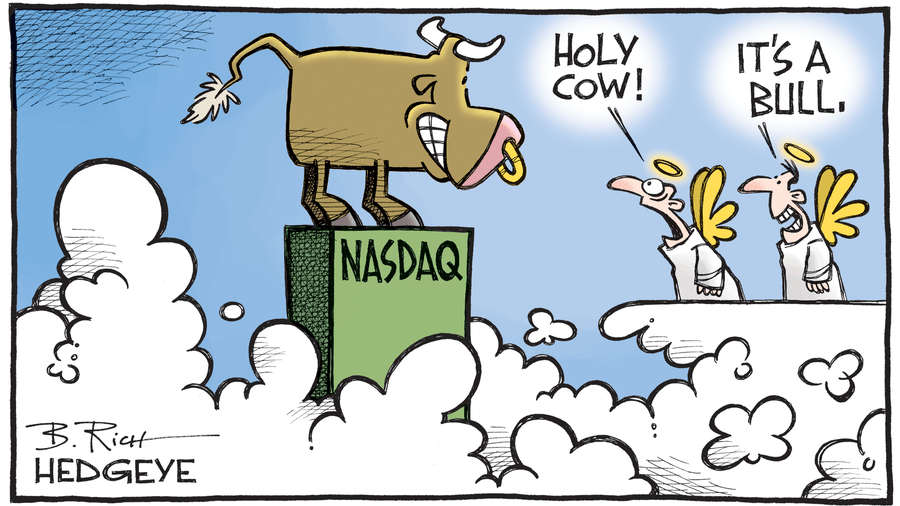
This does not look like concern to us. And frankly, we don’t really believe in market moves triggered by news headlines anyway. The stock market is driven by excess liquidity/money supply growth and psychology (or the social mood if you will) – almost everything else is rationalization. We have seen news headlines in which the same event (for instance rising oil prices) was cited as the reason for a rally on one day and as the reason for a decline on the very next day – and it sounded like a “reasonable” explanation in both instances. This is not to say that we think no rational analysis possible – that is obviously not the case. For instance, one can arrive at fairly robust long term conclusions based on valuations. The old adage “buy low, sell high” really has something going for it, which makes the idea that “Now May Be The Time To Buy A FANG ETF” all the funnier (readers may recall that analysts hated AMZN at its 2006 low of $25, but love it like never before in 2018 at $1,800 – $1,900). If these headlines are to be believed, one must conclude that Wall Street is the Island of the Blessed – nothing can possibly derail the party. |
|
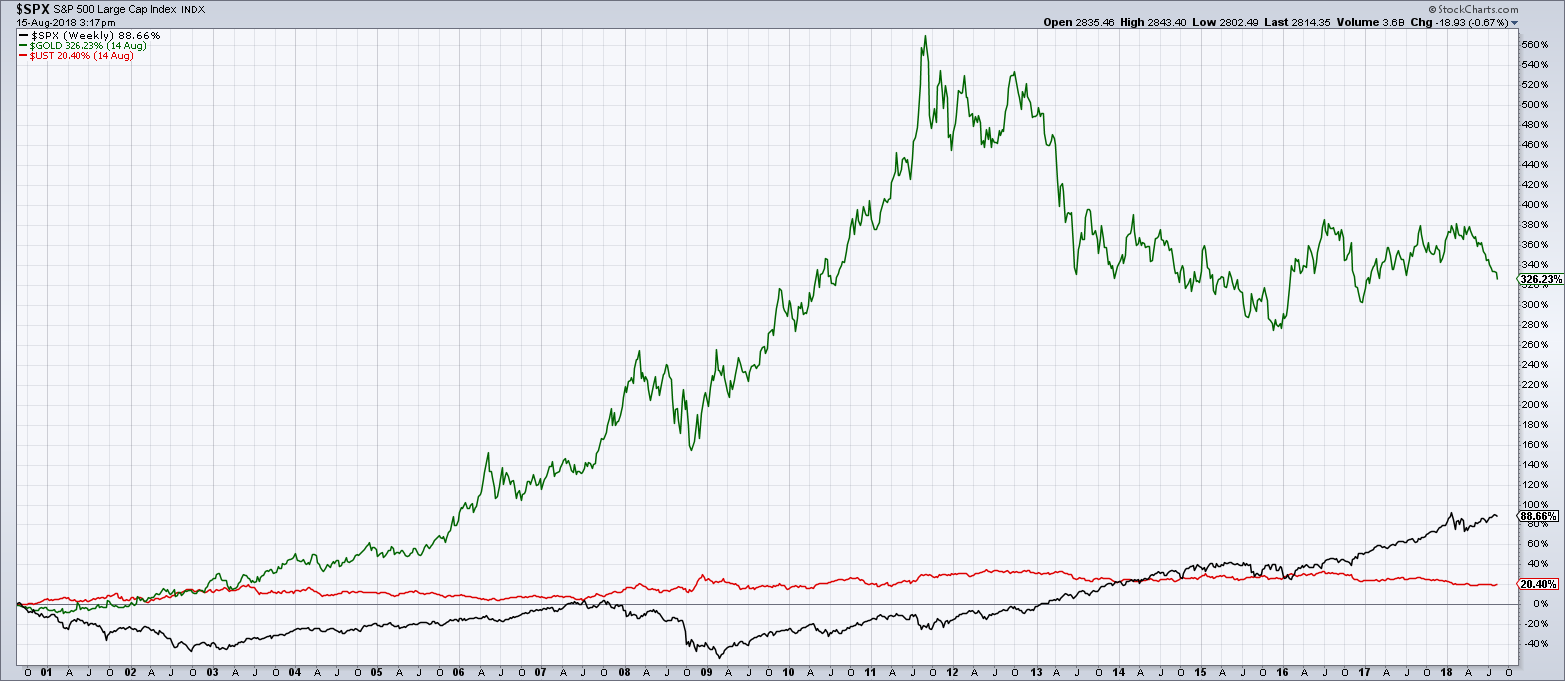
Left for DeadIt is different for gold, with respect to which the following pearl of mainstream news wisdom was dispensed by Marketwatch today: Can there be a worse fate for an asset class than “dying out as an investment”? Especially with a stock market “so good not even Trump can mess it up”? Maybe the assessment that gold is on its deathbed is a bit too hasty though. It has certainly done quite poorly recently, but since its major generational low in 1999-2000, its return still beats that of other major asset classes by a sizable margin. We are well aware that the message of such comparison charts depends entirely on the time frame one happens to arbitrarily pick. We merely want to point out that gold was definitely not the worst investment to be in over the past two decades, despite its poor showing since its 2011 peak and again more recently. Whether it is “dead” remains to be seen – usually when the financial press makes such sotto voce declarations, life soon returns to the allegedly deceased item. Moreover, as we pointed out earlier this week, there have been several occasions when emerging market currency crises occurred shortly before significant lows in gold were put in. |
S&P 500 Large Cap Index 2001-2018(see more posts on S&P 500 Large Cap Index, ) |
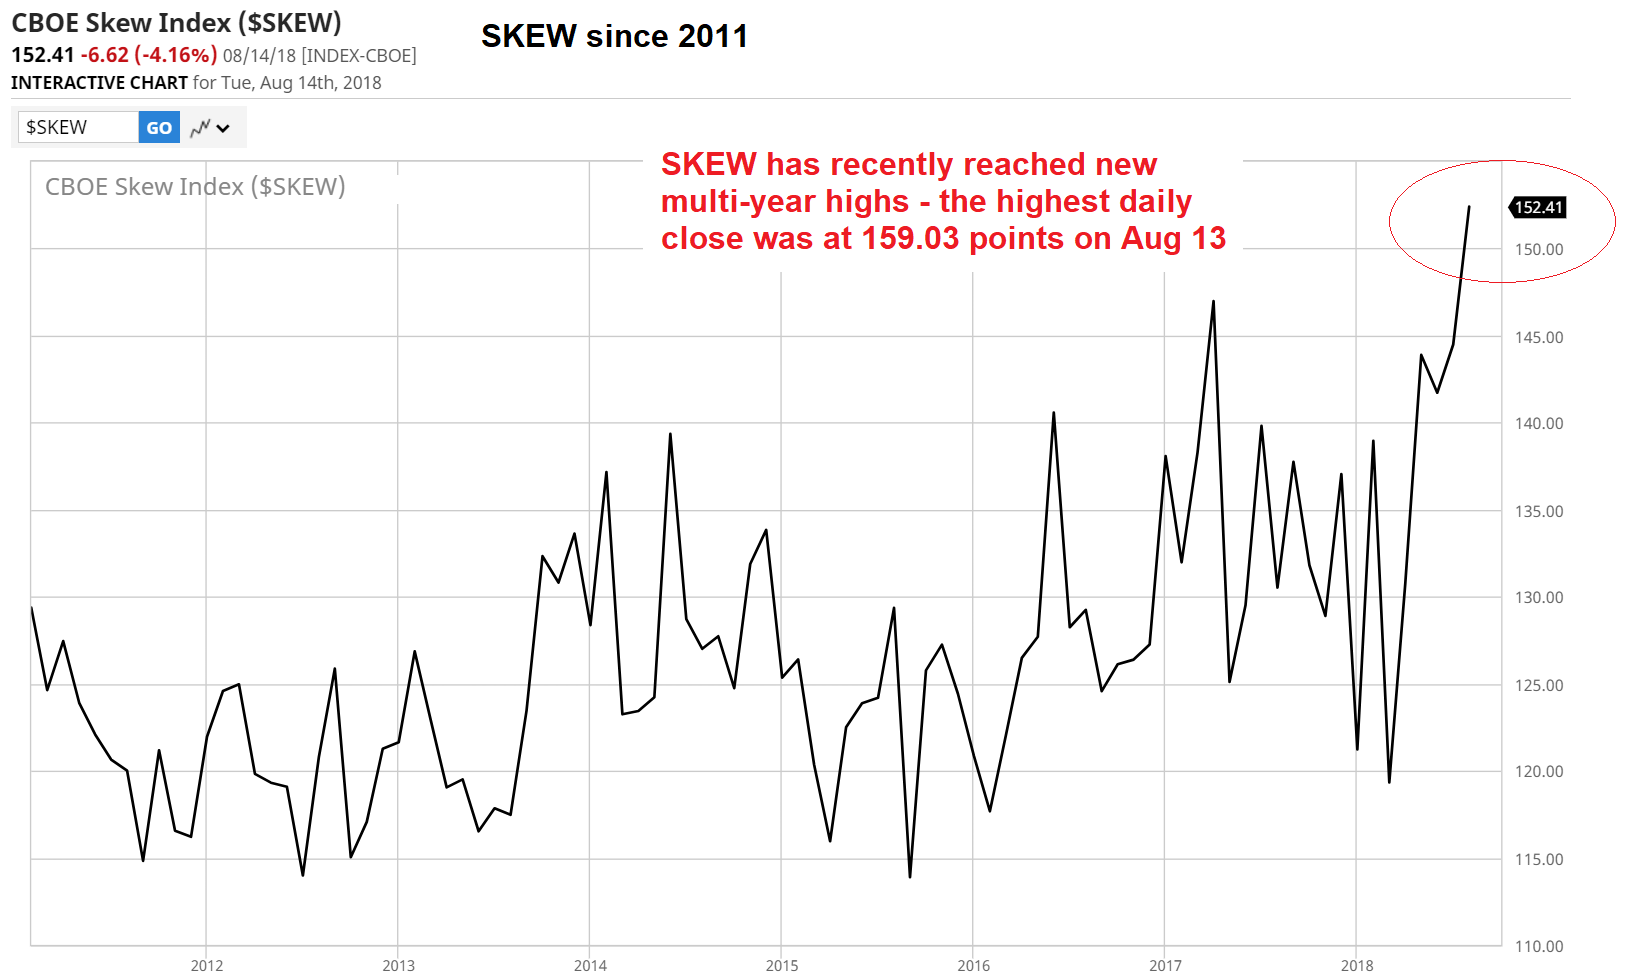
A Small Sign of Concern in a Sea of ComplacencyWhen looking at assorted sentiment and positioning data, signs of stock market exuberance are certainly proliferating. Lance Roberts recently detailed a number of short term positioning and sentiment indicators in an HYPERLINK “https://www.zerohedge.com/news/2018-08-14/it-can-only-go-here”article at Zerohedge. These are all aligned with their medium to longer term counterparts, which have been firmly planted in Lala-land for quite some time. Still, there is one rather more obscure indicator which shows that there is growing concern in one specific corner of the market, namely the CBOE SKEW index. The index is a measure of perceptions regarding tail risk among traders of S&P 500 options (a detailed explanation can be found here). In brief, when the SKEW index rises above the threshold of 100, this group of traders believes that tail risk is rising. The index reflects the relative demand for low strike puts and readings above 100 indicate that the probability of outlier events is held to be increasing. Since SPX options are primarily a playground of institutional traders this is usually not considered a contrary indicator, particularly when high SKEW readings coincide with signs of complacency everywhere else. In short, someone evidently does worry a bit here. We should add that a surge in the SKEW index is not always meaningful, even if it makes new all time highs. Nevertheless, we believe it is definitely a bit of a heads-up when all other sentiment and positioning data are extremely one-sided. |
SKEW, monthly 2011-2018 |
Addendum: Gold and Turkey
Charts by: 4-traders, StockCharts, BarChart
Full story here Are you the author? Previous post See more for Next post
Tags: newsletter,Precious Metals,S&P 500 Large Cap Index,The Stock Market


