


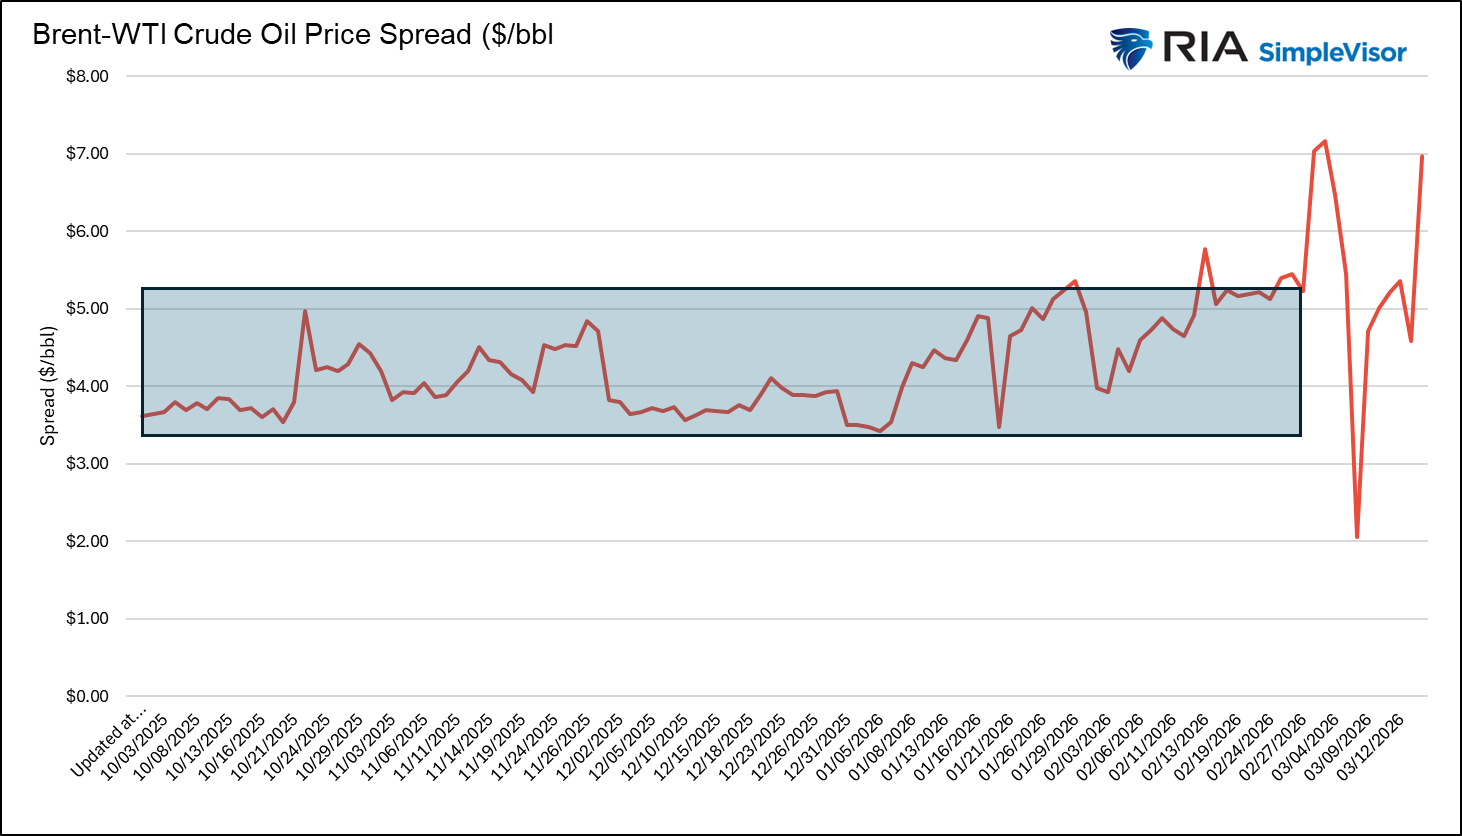
When oil-related geopolitical risk flares up, most investors take their cue from oil prices. While energy prices are vital to monitor, far fewer investors track the telling price spread between Brent and WTI oil. West Texas Intermediate or WTI is the US domestic oil price benchmark, priced at Cushing, Oklahoma, and largely reflects North American supply and demand conditions. Brent is the global oil benchmark, priced off North Sea crude oil. Its price closely tracks the international supply and demand dynamics, and importantly, today, the seaborne oil that flows through the Persian Gulf and the Strait of Hormuz. Under normal conditions, Brent trades at a $2-$5 premium over WTI.
When that premium widens or shrinks rapidly, the market is conveying important information. In the context of the current Iranian conflict, the Brent WTI spread is therefore one of the cleanest real-time signals available about what oil producers, corporate energy users, and traders are thinking. A widening Brent WTI spreads indicates that oil markets are pricing in a global supply shortfall. A stable or narrowing spread, even amid elevated spot prices, would be the market's way of signaling that the disruption is expected to be temporary and contained
As we share below, the spread has been volatile. Currently, the Brent WTI spread is large at $7.00, indicating that the market suspects the conflict will continue to weigh on global oil supplies. However, the spread has been highly volatile, shifting violently from one headline to the next.
What To Watch Today
Earnings

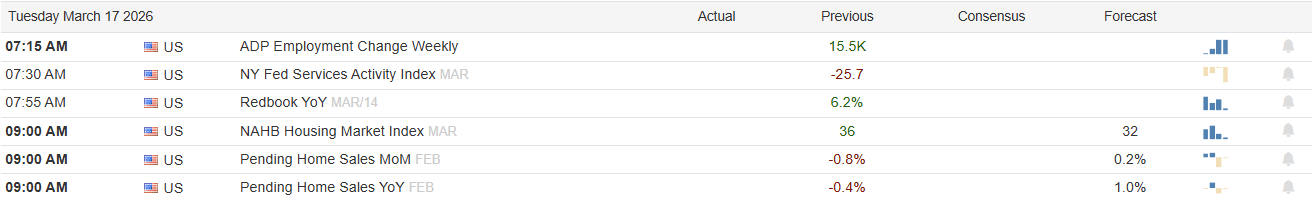
Economy
Market Trading Update
Yesterday, we laid out the technical backdrop for trading the market this week. During The Real Investment Show, I noted that the market was now oversold enough for a reflexive rally, driven by the confluence of several technical supports.
First, institutions have heavily shorted the market during the recent decline. As shown, US-listed ETF shorts on the Goldman Prime book increase by 10%, the 2nd-largest 1-day increase on Goldman's record, second only to the +16% increase seen on April 2, 2025, aka Liberation Day.

Secondly, during March 3rd - 10th, Asset Managers sold $36.2bn per Commitment of Traders, marking a 10+ year record in notional terms.

It is worth noting that previous such selloffs occurred near market lows in December 2018, March 2020, and October 2022. In other words, managers' actions tend to be a contrarian indicator of the market as a whole.
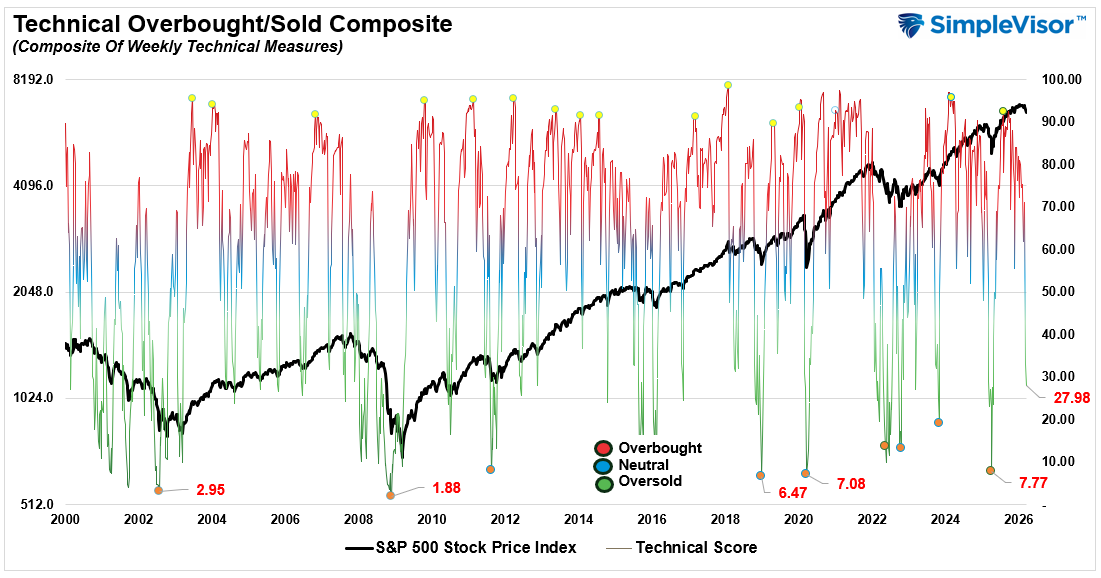
Third, the market's technical condition is getting decently oversold, as shown in this past weekend's #BullBearReport. As shown, the market has reached levels coincident with short-term bottoms as investor sentiment becomes increasingly negative.
As we noted in Technical Deterioration, rallies are likely to be limited to more challenging overhead resistance. To wit:
"Volume analysis confirms the technical deterioration is driven by institutional activity, not retail noise. The March 5 breakdown through the 100-day moving average occurred on volume roughly 20–25% above the 20-day average, the signature of conviction selling. The volume profile’s Point of Control over the past 90 days sits near 6,860–6,900, indicating that the bulk of positions accumulated during the consolidation phase are now underwater. That overhang creates additional selling pressure as trapped longs reduce exposure."
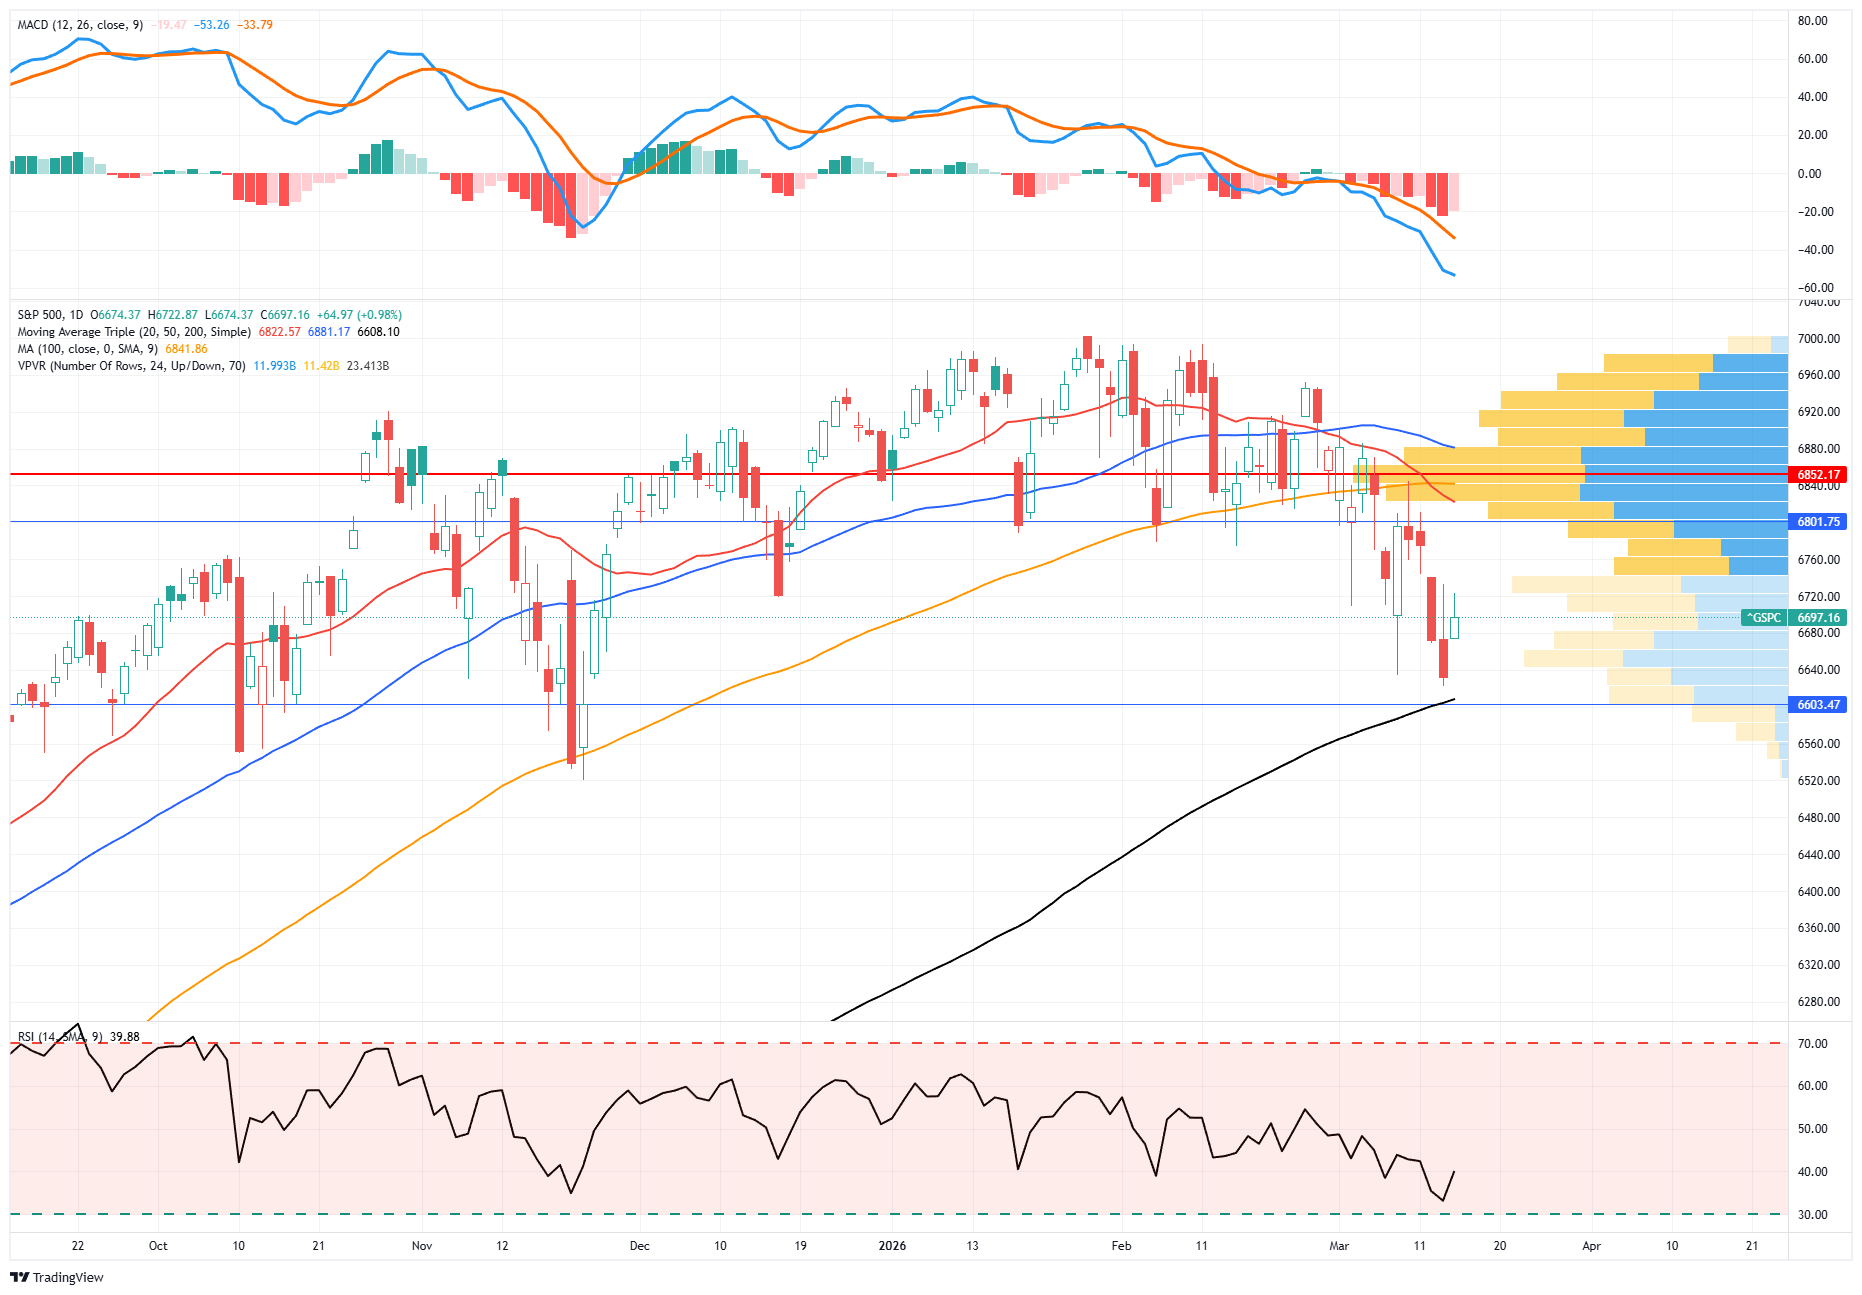
The playbook remains the same from last week:
- Any relief rally into the 6,830–6,850 zone, where the broken 100-day and 50-day moving averages should now act as resistance, presents an opportunity to initiate hedges or reduce long exposure, with a stop at 6,960 above the prior Point of Control.
- For long-only portfolios, raising cash to 10–15% of the portfolio and increasing short-term bond holdings can provide a decent hedge against further volatility. However, be patient before becoming overly defensive, as the market is already short-term oversold enough to support a reflexive rally.
Trade accordingly.

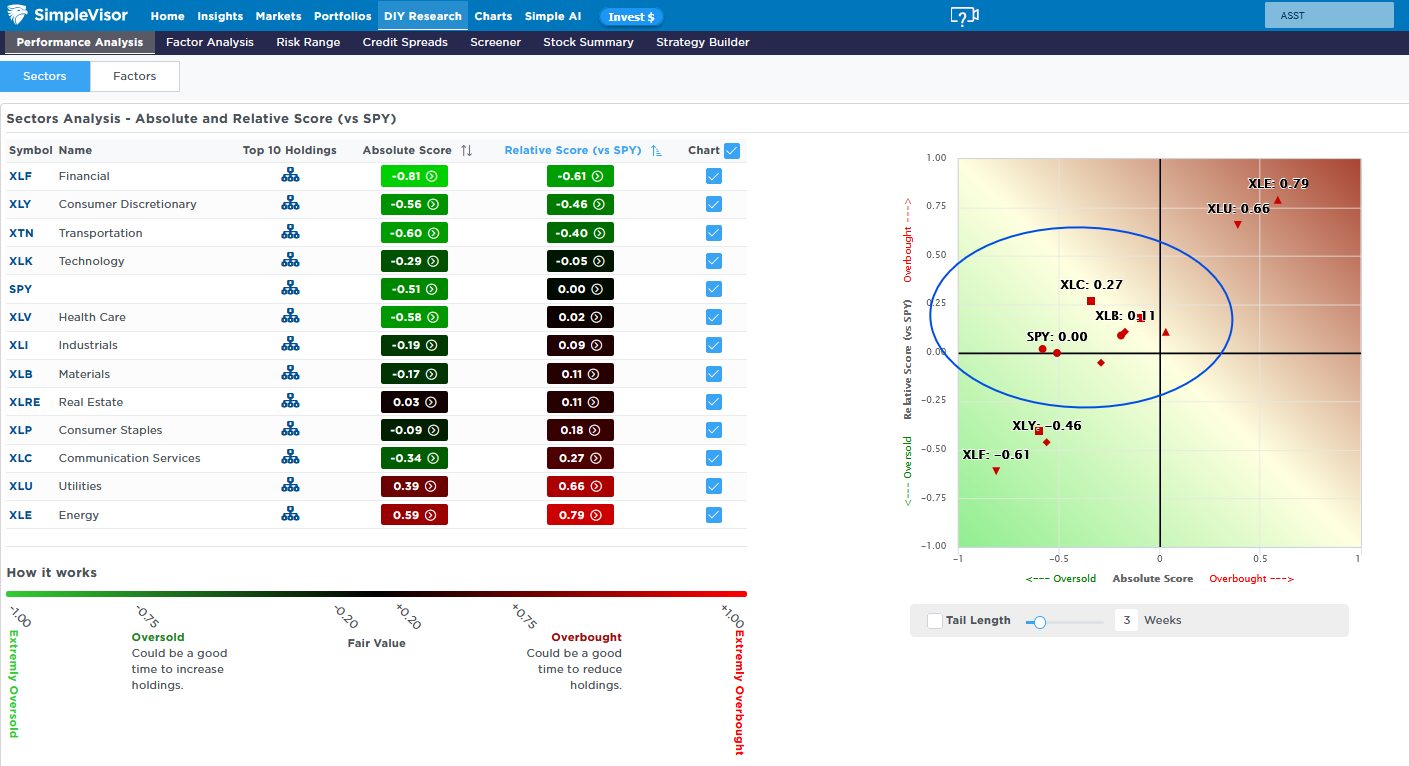
S&P 500 Lags Most Sectors
Last week, the S&P 500 was down less than half a percent; however, from its Tuesday peak, it was off slightly over 3%. It is about 5% lower than recent highs. As shown in the SimpleVisor screenshots below, most sectors are outperforming the market according to our absolute and relative analyses. The blue circle in the top graphic indicates that most sectors are currently in the top-left quadrant. This indicates they are slightly overbought relative to the S&P 500 but slightly oversold based solely on their technicals.
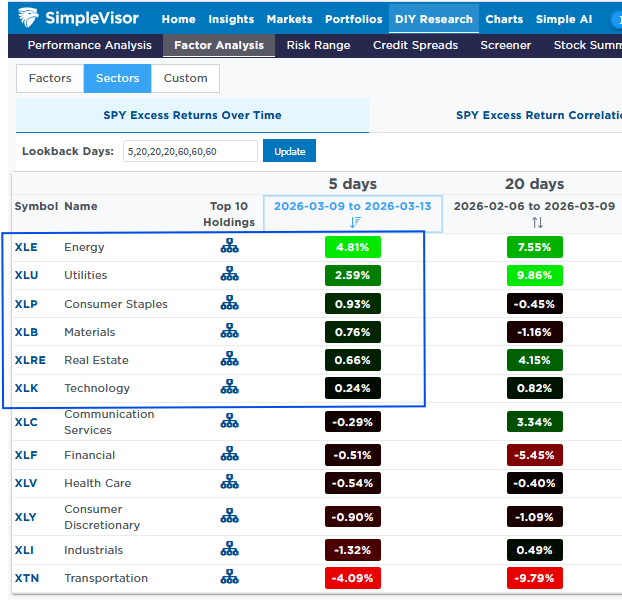
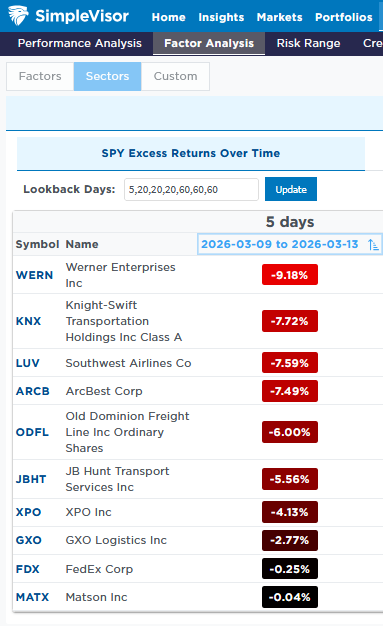
The second graphic shows each sector's excess performance versus the S&P 500 over the last five days and the 20 days preceding that. Not surprisingly, the transportation section is grossly lagging the market during this time. The third graphic highlights the transportation sector's top ten holdings. The companies most dependent on oil prices (trucking, freight, and airlines) are, as we would expect, the most impacted. Moreover, these companies' earnings are highly correlated with economic activity. Thus, the combination of high oil prices and the growing likelihood of weaker economic activity is dragging their share prices lower. The longer this conflict wages, the more likely they are to underperform. Accordingly, while the sector may become very oversold, it may remain so until peace emerges.
Treasury Bonds Don't Lie: But Wars Don't Drive Them
This past weekend, Adam Taggart and I discussed what happens to Treasury bond yields when the United States enters a military conflict. The conventional wisdom is reflexive and tidy. A conflict triggers a flight to safety, money floods into U.S. government bonds, and yields fall. It’s a clean narrative. Unfortunately, it is wrong more than right, for reasons that have very little to do with the conflict itself, as shown, yields tend to rise about 60% of the time.

The U.S.-Iran war that began on February 28, 2026, has already exposed the flaw in that thinking. Rather than falling on safe-haven demand, the 10-year Treasury yield climbed from 3.96% at the end of February to as high as 4.26% within the first week of fighting.
Tweet of the Day

“Want to achieve better long-term success in managing your portfolio? Here are our 15-trading rules for managing market risks.”
Please subscribe to the daily commentary to receive these updates every morning before the opening bell.
If you found this blog useful, please send it to someone else, share it on social media, or contact us to set up a meeting.
The post The Brent WTI Spread: The Market’s Take On Iran appeared first on RIA.
Full story here Are you the author?You Might Also Like
 Market Topping Process?
2026-02-28
🔎 At a Glance Give Us A Review ***** If you enjoy our work each week, could you be so kind as to leave us a review? It would be most appreciated. 🏛️ Market Brief – Turmoil In AI Stocks As we will discuss further in today’s commentary, the market remains stuck in a fairly narrow …
 Mag 7 Debt & Declining Free Cash Flow: Worrisome Or Not?
2026-02-23
We have read a few articles expressing concern that the free cash flow for many of the Magnificent (Mag) 7 companies that are heavily involved in AI development and/or data center construction has leveled off. Furthermore, the hyperscalers, including Amazon, Microsoft, Google, and Oracle, issued over $120 billion in debt last year. Additionally, Google just …
 Transportation Stocks Are At Odds With Truck Sales
2026-01-14
Yesterday’s Commentary noted the recent strength in transportation stocks. For example, the transportation ETF (XTN) has outperformed the S&P 500 by more than 9% over the last 25 trading days. The leading stocks within the ETF over this period include. ARCB (trucking), MATX (shipping), WERN (freight shipping), and FedEx (shipping). Some of the recent gains …
 Market Outlook For 2026
2026-01-03
🔎 At a Glance 💬 Don’t Miss Our Upcoming “Live & In Person” Summit Our 2026 Summit is a limited-seating event, so secure your tickets now before they sell out. Topics Include: I look forward to seeing you there. 🏛️ Market Brief – Strong Year-End Returns Lead to Bullish Market Outlooks Let’s start this week …
Tags: Featured,newsletter


