Warren Buffett’s company, Berkshire Hathaway, has about $325 billion in cash, accounting for over a quarter of its portfolio—the highest percentage in over 30 years. The question begging an answer is, what is worrying Warren Buffett?
We believe the answer is valuations. We have shared numerous charts over the last few months showing how valuations are on par or even higher than those of 1999 and 1929. Warren Buffett's preferred market valuation metric is the ratio of the total stock market cap to GDP. The ratio stands at 230%, 2% below the level when the market peaked in 2021 and well above 175% in 1999. The foundation of this calculation is that earnings, thus ultimately asset values, are the result of economic activity. Therefore, a rising ratio potentially signals investors are expecting too much future earnings growth.
We turn to our friends at Kalish Concepts and their recent paper- Market Cap To GDP- The Importance of Basic Arithmetic. The article shows that not all stocks are overpriced. In their words:
This is a problem that is being driven almost entirely by the 50 largest stocks in the market
Their first graph below shows the ratio of the market cap of just the largest 50 stocks to GDP. The ratio is well above 1999 and a good amount higher than late 2021. The second graph provides a slightly different context. Per Kalish:
The line merely divides the 50 biggest stocks market cap to GDP by the overall market cap to GDP. This shows what percentage of the total market’s valuation is being driven by the 50 largest stocks. Out of 5,166 stocks, America’s 50 largest companies now account for nearly half the market’s total valuation – a record.
The good news, per Kalish, is that there are plenty of stocks without high valuations offering a potential port in the proverbial storm when large-cap valuations correct. The biggest question, however, is when.

What To Watch Today
Earnings
- No earnings releases today.
Economy

Market Trading Update
Yesterday, we noted that the market needs to rally here soon as critical support levels are now under threat. Some catalysts today, tomorrow, and Thursday could undoubtedly provide a bounce. Over the next two days are inflation reports (PPI and CPI) where a weaker-than-expected reading could send stocks sharply higher as traders reassess Fed rate cut policies. Thursday, earnings season gets underway, and the major banks are reporting. The recent weakness in the market has been partially attributable to the "buyback blackout" period, which will begin to reopen next week as corporate earnings for Q1 ensue slowly.
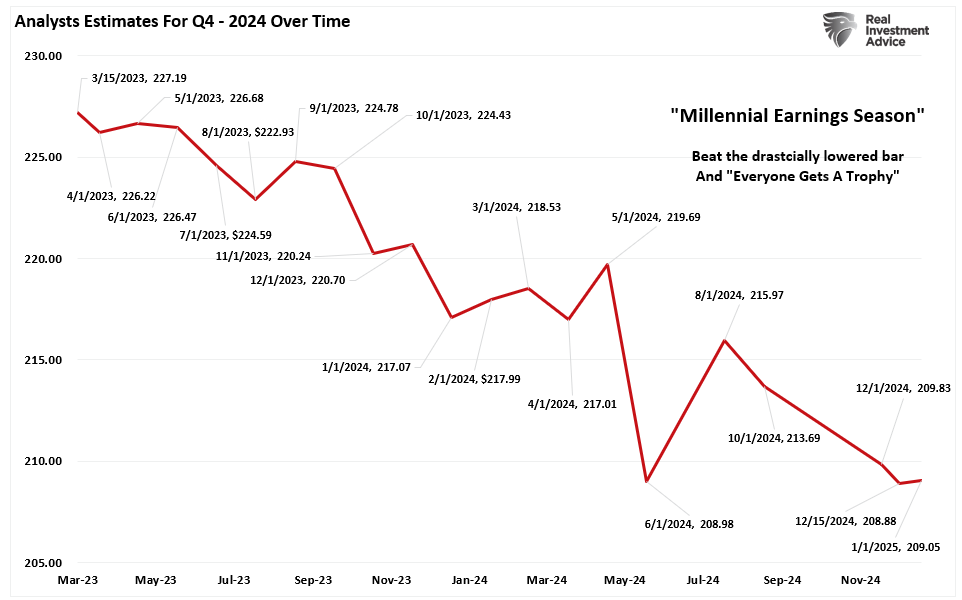
Estimates for Q4 earnings have declined from $227/share to $209/share, which makes the bar easier for companies to beat. Therefore, as is almost always the case, investors should expect a high "beat rate" during this earnings season.

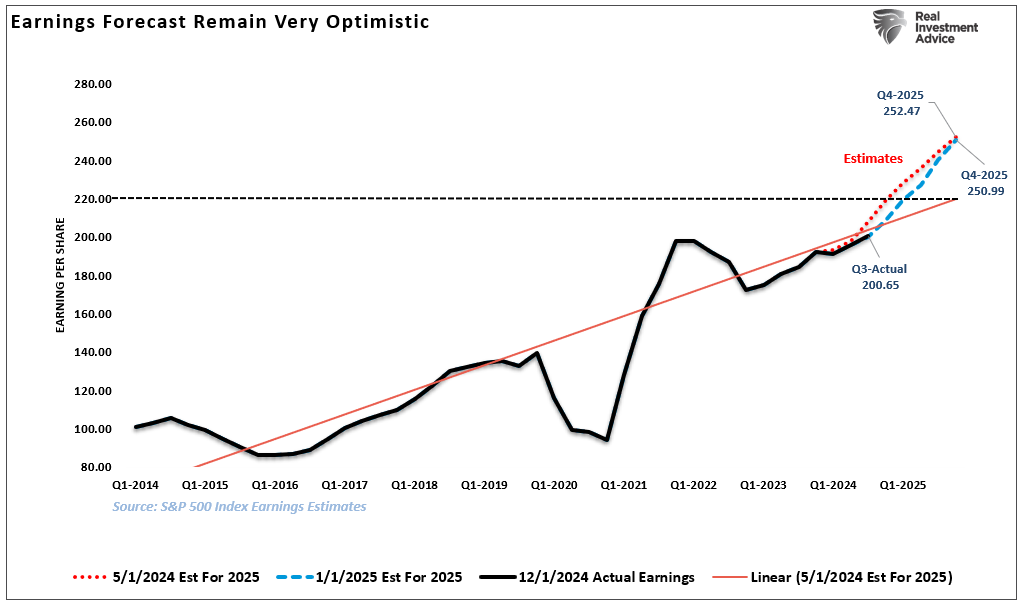
However, despite the decline in Q4 estimates, the real risk to earnings in 2025 is that current year-end expectations are significantly higher than the long-term earnings growth trend. As shown, earnings tend to gravitate around the growth trend, so Q4 estimates fell from $227 to $209, which is about where they should be. However, 2025 remains significantly deviated above that growth trend, suggesting that earnings should be closer to $220 versus $250/share.

Given current valuations, that difference in earnings is very significant. For example, let's assume the market trades at 25x earnings for 2025. At $250/share, that would suggest the market would end the year at 6250, which would roughly imply a 7.8% increase from current levels. However, if earnings return to their long-term growth trend of $220/share, the market return expectation falls to a year-end price of 5500 or a roughly 5.1% decline.
For investors, watching Q4 earnings, and more importantly, corporate outlooks, will give us better guidance to set our expectations. However, over the next few days, the markets are decently oversold enough for a reflexive bounce. Given the risk to earnings, any bounce will likely be a good opportunity to rebalance risk and reduce overall portfolio volatility for now.

Inflation Expectations Are Political
The graph below, courtesy of Bloomberg, is one of the most stunning charts linking economics and politics. As shown, expectations for inflation in the University of Michigan consumer survey completely flipped after the election. Thus, when people say bond yields are rising because inflation expectations are increasing, it's worth contemplating whether that is due to a shift in politics or a valid concern.

A Shift To The Lower Left
Unsurprisingly, SimpleVisor absolute sector scores are becoming oversold with the recent market decline. Furthermore, the S&P 500 index has been outperforming just about every sector. As a result, most sectors, as shown in the scatter plot below, have shifted to the lower left quadrant. The lower left quadrant contains the oversold sectors versus the S&P 500 and on an absolute basis. It's also worth noting that healthcare and transportation now have positive relative scores, showing they are slightly overbought compared to the market. The two sectors were among four or five that were very oversold in December. Simply put, with the market decline we have seen a rotation into the neglected sectors.
The absolute scores are declining on both the sector and factor analysis but not necessarily to levels that denote a bottom. Typically, we witness scores of -70 or lower in many sectors and factors before a market is considered very oversold. That said, breadth has vastly improved due to the recent decline.

Tweet of the Day

“Want to achieve better long-term success in managing your portfolio? Here are our 15-trading rules for managing market risks.”
Please subscribe to the daily commentary to receive these updates every morning before the opening bell.
If you found this blog useful, please send it to someone else, share it on social media, or contact us to set up a meeting.
The post Buffett Is Worrying, Should You? appeared first on RIA.
Full story here Are you the author? Previous post See more for Next postTags: Featured,newsletter


