Berkshire Hathaway now sits on $373 billion in Cash. They have enough to buy 480 companies in the S&P 500. For context, this is the largest cash stockpile since 2008. At that time, Berkshire used its cash not to buy stocks on the open market but largely to offer companies private deals that ordinary investors couldn't access. In doing so, they extracted extremely favorable terms from desperate companies in exchange for providing much-needed capital and Berkshire's confidence stamp of approval to soothe anxious investors.
The most notable trades included:
Goldman Sachs (September 2008): Berkshire invested $5 billion in Goldman preferred shares paying a 10% annual dividend, plus warrants to buy $5 billion in common stock at $115 per share. Goldman eventually paid Berkshire roughly $500 million to redeem the preferred shares early.
General Electric (October 2008): This was nearly identical to the structure Berkshire had with Goldman: $3 billion in preferred shares with a 10% dividend, plus warrants. GE was widely seen as teetering at the time, and Berkshire's investment served as a powerful signal of public confidence.
Wrigley/Mars (2008): Berkshire provided $6.5 billion in financing to help Mars acquire Wrigley, earning a high fixed return with minimal equity risk.
This raises the question: if, as an investor, you want to raise cash to reduce risk, might you be better served by buying Berkshire Hathaway shares and participating in its deal-making if the markets enter crisis mode?

What To Watch Today
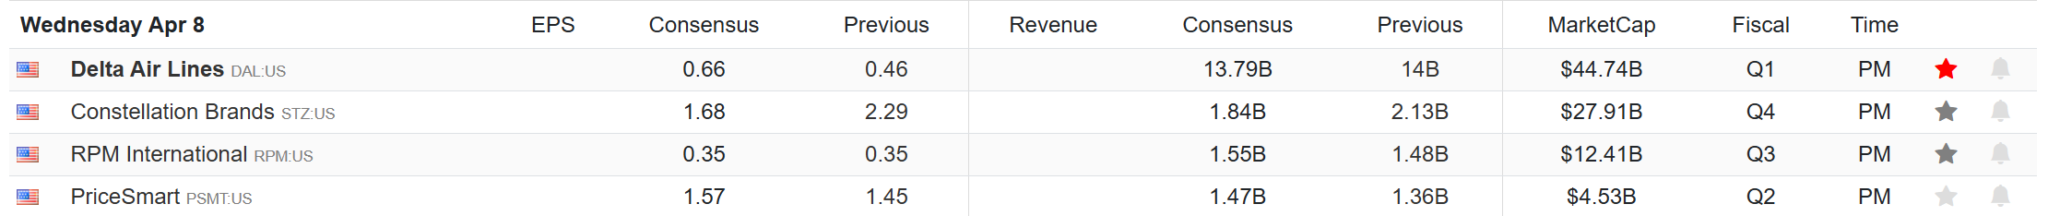
Earnings
Economy

Market Trading Update
Yesterday, we discussed a couple of reasons why the market could rally even as the financial media has been working overtime to convince investors that the sky is falling. Iran tensions, tariff escalation, recession fears, and misguided narratives of "stagflation," even though the US economy is nowhere near meeting that definition. However, the narrative is as dark as it gets, which is great for clicks and views. But here is the truth: markets don't bottom on good news. They bottom when fear is so thick you can taste it, and right now, the data suggests we're getting close to that point.
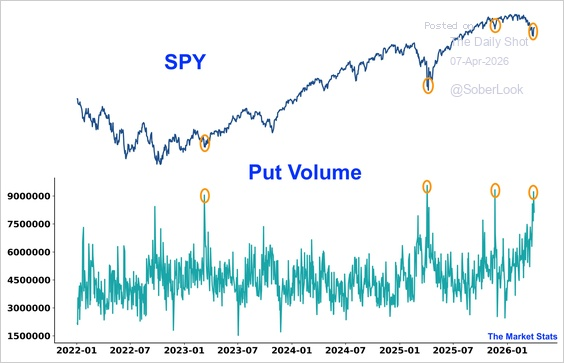
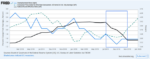
Start with put volume. As the first chart shows, SPY put volume recently hit its third-highest level on record, going back to 2022. That's not a bearish signal; it's a contrarian one. The prior spikes in put volume circled on that chart all coincided with significant market lows, not tops. When everyone is buying protection at the same time, it typically means the worst is already priced in. Panic is a leading indicator of relief rallies, not continued declines.

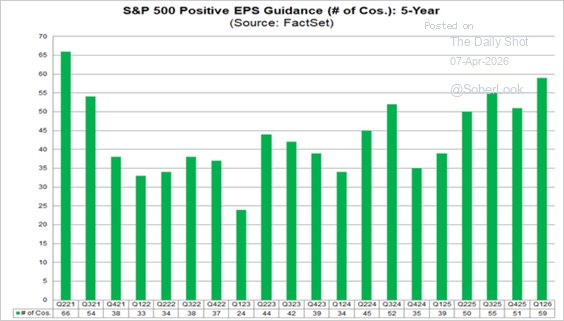
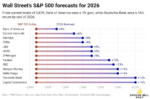
Then there's the earnings picture, where the Iran risk argument gets interesting. The FactSet data in the second chart shows that 59 S&P 500 companies issued positive EPS guidance in Q1 2026, the highest count in five years. Analysts have been revising numbers higher, not lower. That doesn't scream recession.
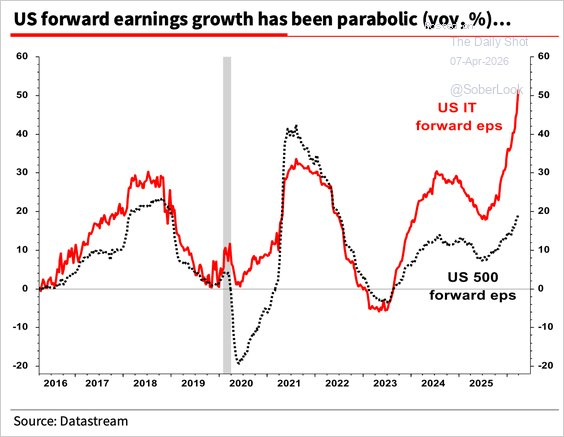
And the third chart from Datastream drives the point home — U.S. IT sector forward EPS growth has gone parabolic, with broad S&P 500 forward earnings still solidly positive year over year.
So here's the disconnect worth watching. Valuations have compressed sharply over the past several weeks. If earnings estimates are holding and forward EPS is still rising, then the market is simply cheaper today than it was in February. Iran is a real geopolitical risk, but risk assets often price geopolitical shocks faster than the headlines suggest. By the time CNN is running wall-to-wall coverage, the institutional bid is frequently already forming beneath the surface.
None of this is a guarantee. Which is why we added to our near term market hedges. But the point is that markets can and do overshoot to the downside. But the combination of extreme put hedging, resilient forward earnings, and compressed valuations sets up a better risk-reward than the current headlines imply.
Trade accordingly.

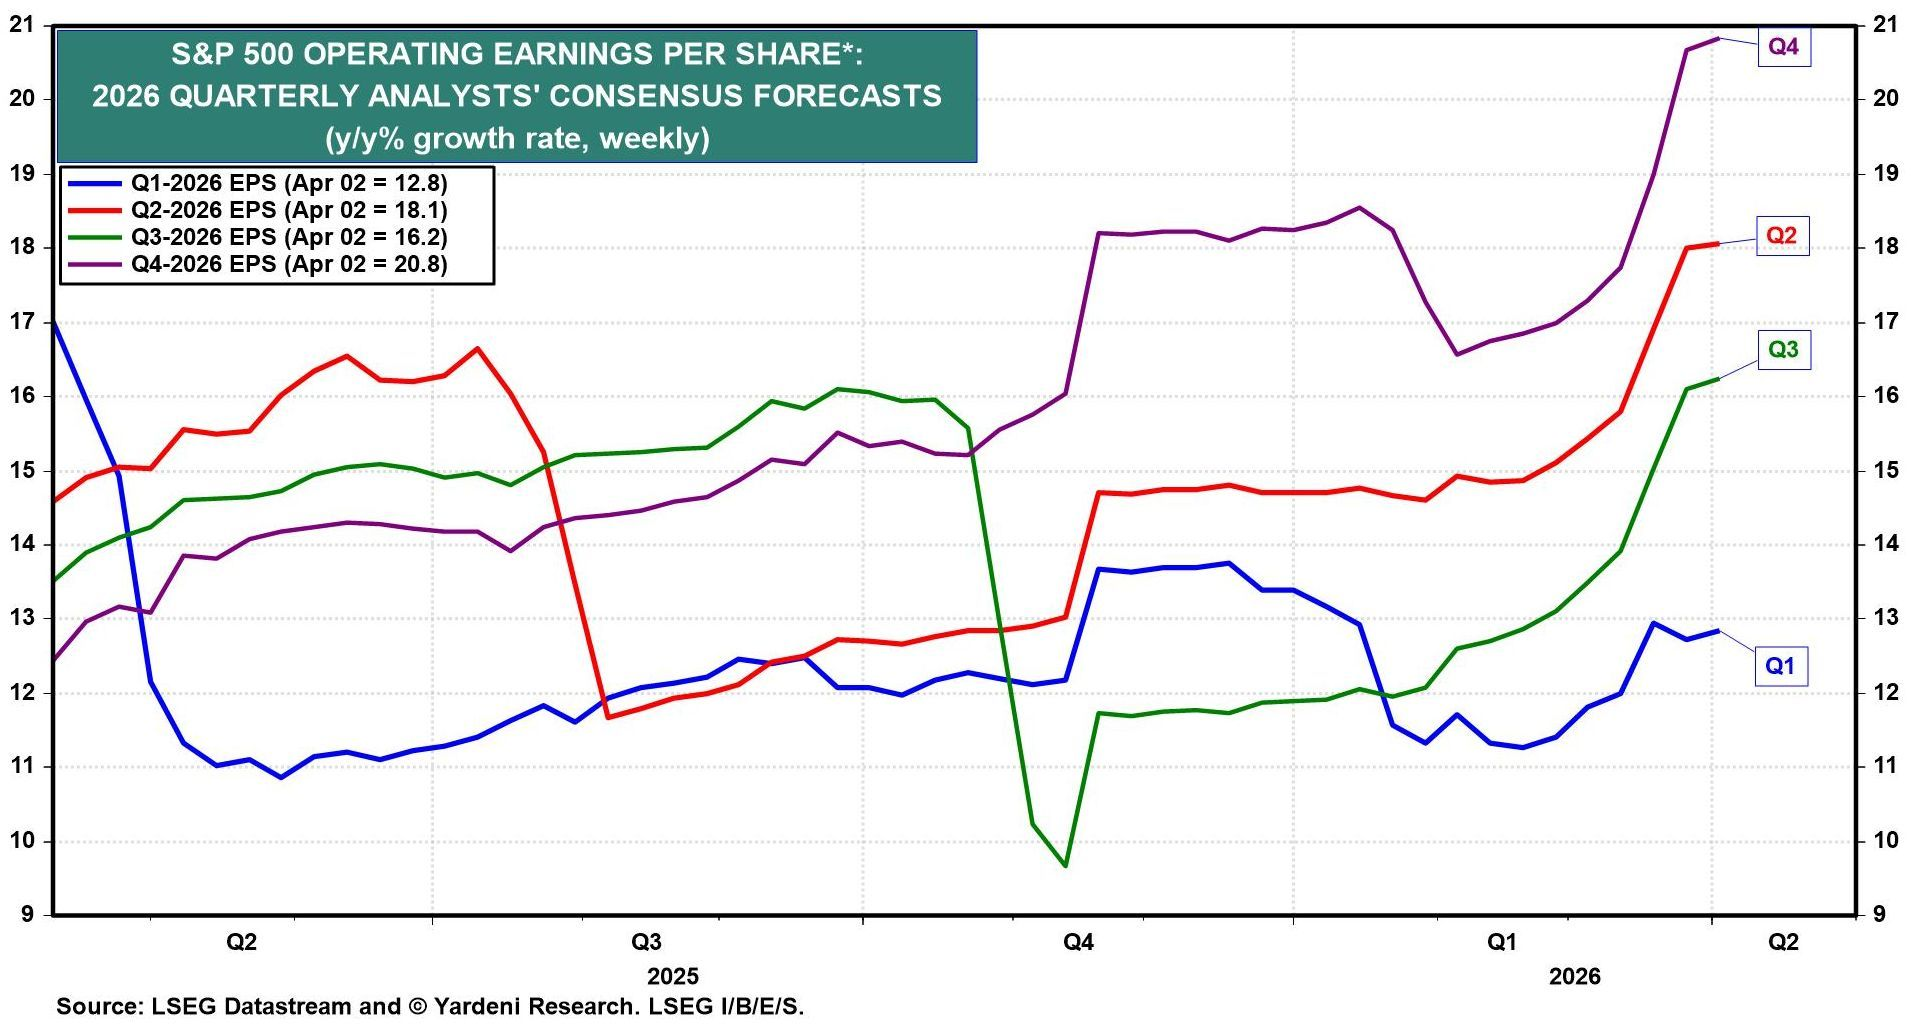
Earnings Forecasts Create A High Bar
Despite the conflict in Iran, Wall Street analysts have been raising their earnings forecasts for the rest of the year in recent weeks. As the graph below shows, courtesy of Ed Yardeni, Wall Street expects >20% year-over-year growth in the fourth quarter. Again, earnings expectations are rising despite higher oil prices and the potential negative impacts on consumer and business sentiment. It's also worth considering that only two sectors, technology and energy, are driving the increased expectations. Consider the following statement from FactSet:
Outside of the Information Technology and Energy sectors, the only other sector that has recorded an increase in dollar-level earnings since December 31 is the Financials sector (+0.4%).
Three thoughts:
- Given that only two sectors are driving the higher expectations, higher earnings forecasts do not signal a broad-based economic resurgence as some believe.
- The market will likely pay more attention than usual to the upcoming guidance in Q1 earnings reports to better forecast earnings. Poor guidance, as we saw from Nike last week, could weigh heavily on stocks.
- Stock prices will want earnings to beat expectations to push the market higher. Thus, even if earnings meet the bold expectations, it may not be enough to satisfy investors.
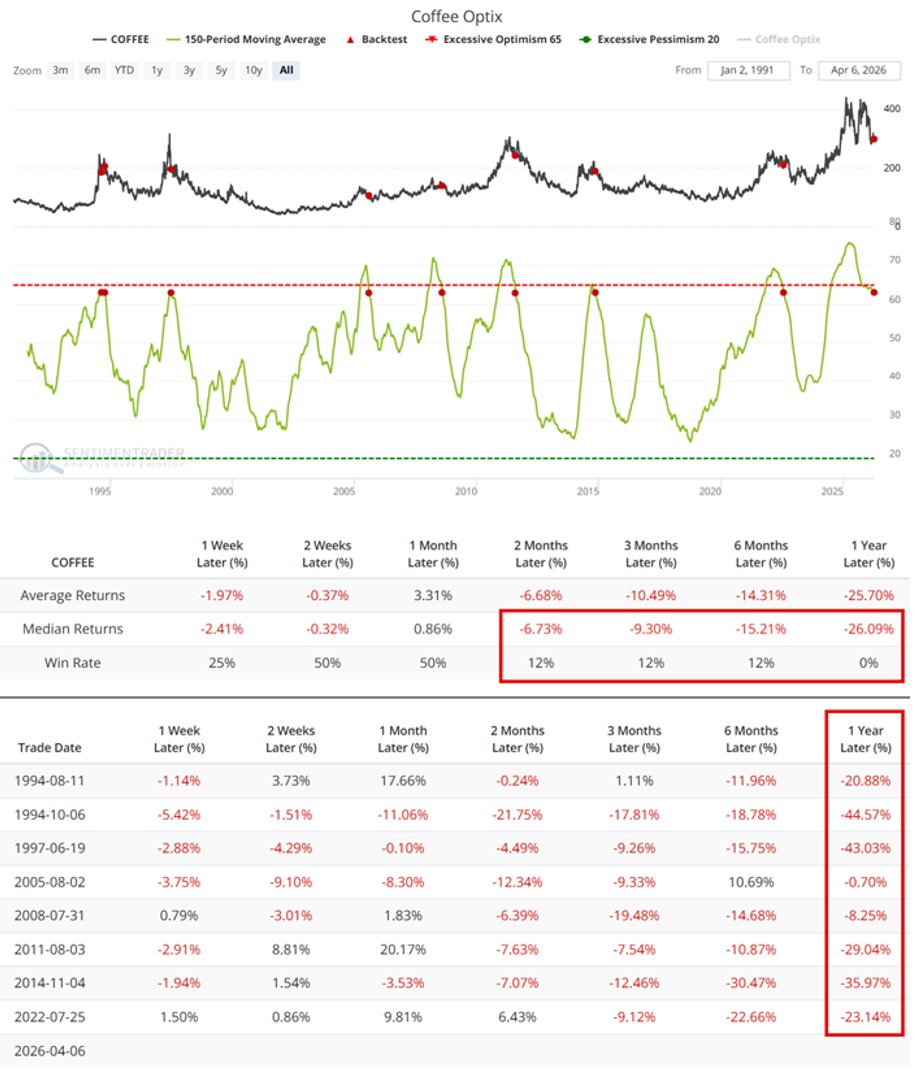
Coffee Drinkers Might Rejoice
The graph below, courtesy of Sentimentrader, may foretell lower coffee prices at your favorite diner over the next year. The top graph below shows the price of coffee. The red dots highlight periods when the 150-period moving average of their proprietary Optix-sentiment index (green line) reached 65 or higher and then retreated below 65. Optix is based on a scale of 0 to 100 and uses factors such as options data, futures positioning, and volatility indicators. The tables below the graphs backtest the dotted periods and find that, on average, coffee declines by about 25% after meeting their 65-optimism rule.
Tweet of the Day
“Want to achieve better long-term success in managing your portfolio? Here are our 15-trading rules for managing market risks.”
Please subscribe to the daily commentary to receive these updates every morning before the opening bell.
If you found this blog useful, please send it to someone else, share it on social media, or contact us to set up a meeting.
The post The Berkshire War Chest: A Crisis Hedge? appeared first on RIA.
Full story here Are you the author?You Might Also Like
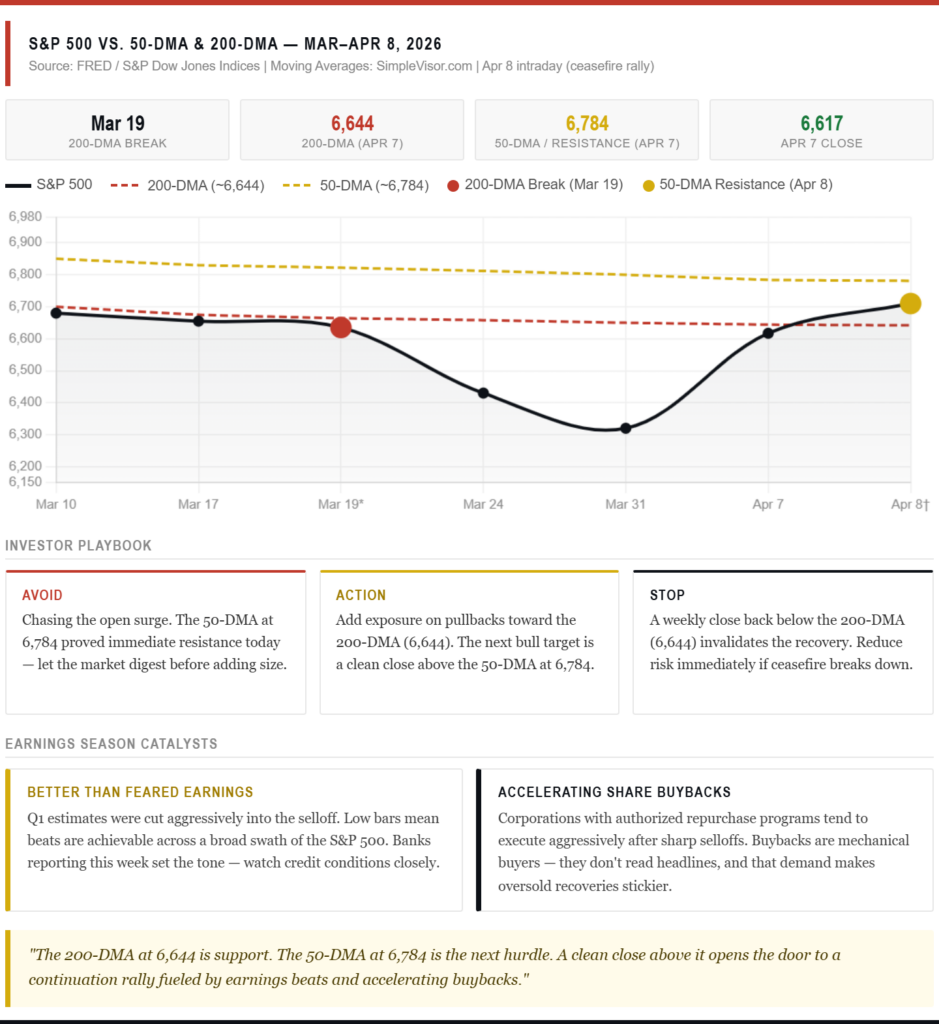
 The 200-DMA Just Broke: What Every Investor Should Know
2026-03-23
There are hundreds of technical indicators that market analysts track, but only one gets a live television chyron the moment it breaks. The 200-day moving average (200-DMA) is the single most widely followed technical level in global financial markets, and the reason isn’t mystical; it’s institutional. Quant funds, pension allocators, programmatic traders, systemic funds, and …
 Private Credit Stress: Will The Fed Backstop Excuberance Again?
2026-03-18
The Fed is governed by its dual Congressional mandates of price stability and maximum employment. At times, however, the Fed throws these mandates out the window to protect the financial system. With liquidity and credit stress in the private credit market rising, we must consider whether the Fed might once again ignore its mandates to …
 The South Park Market Of 2026
2026-01-23
I have been a “South Park” fan for as long as I can remember, and while the show isn’t a market guidebook, its brutal satire cuts through nonsense better than many Wall Street commentaries. Just like on the show, characters make absurd decisions and face absurd consequences, which is familiar to investors today. For example, …
 The DPI Link To Margin Debt
2025-12-08
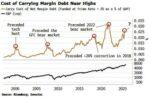
A recent article by Simon White, via Bloomberg, discussed the rising cost of margin debt for investors. While his analysis below compares the cost of debt to GDP, we will also consider a more critical comparison to disposable personal income (DPI). Here is Simon’s point. “Yet, where history does raise a red flag is if …
 Jobs Data From Alternative Sources May Drive Fed’s Next Move
2025-12-05
With the federal government shutdown delaying critical economic reports, the official jobs data remains incomplete. Last week, the Bureau of Labor Statistics (BLS) released the September jobs report. However, the October report, originally expected earlier this month, remains in limbo, potentially permanently. The reason is due to the shutdown, as the BLS was unable to …
 Liquidity Warning: SOFR Raises The Red Flag
2025-10-17
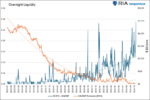
In our Daily Commentary from October 9th, we alerted readers to the fact that the Fed’s Overnight Repurchase Program was warning that the financial system was running out of a reliable store of excess liquidity. While not a concern, as we share in our quote below, it was worth monitoring. Said differently, after years of …
 Dollar Correlation: Implications For Foreign Stock Indexes
2025-10-15
On Tuesday morning, Bloomberg featured an article entitled The Great Debasement Is Rippling Across Markets. From the start of the year until its low in the middle of September, the US dollar index fell by nearly 15%. The weak dollar seems to fuel the debasement narrative, benefiting a few asset classes. The most obvious assets …
Tags: Featured,newsletter