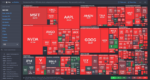
Many investors consider a 20% drawdown or more to be a bear market. Based solely on that definition, the table below, courtesy of Morgan Stanley, shows that 42%, or over 200 of the S&P 500 members, are in a bear market. For context, the S&P 500 is only down 4% from its 52-week record high, well short of what anyone would deem a bear market.
The table shows the distribution of drawdowns from 52-week highs by severity, sorted by S&P 500 sub-sector. Not surprisingly, the software industry, with 97% of its companies down by 20% or more, is the worst-performing sector. Behind that are automobiles at 75% and media & entertainment at 63%. On the other hand, there are no energy stocks in a 20% drawdown bear market, and only 6% of utility stocks are down 20% or more. Staples have also been outperforming, with 14% of members trading in bear market territory.
This analysis is yet another confirmation of the wide dispersion of returns in the constituents of the S&P 500 and yet relatively calm trading in the index itself. For more, check out our article: Calm Market Waters Hide Fierce Undercurrents.

What To Watch Today
Earnings
- No notable reports today.
Economy
- No notable reports today.
Market Trading Update
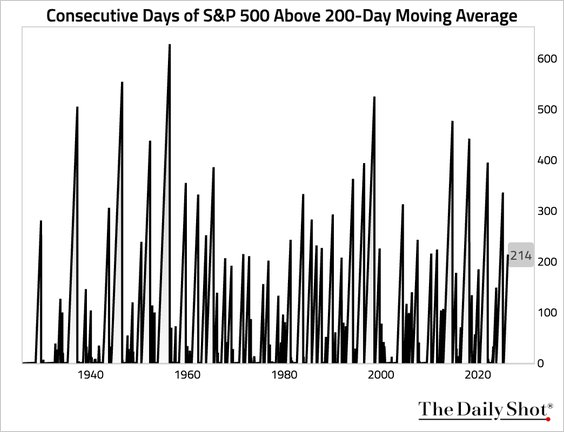
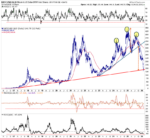
Yesterday, we touched on credit spreads and the risk signals they provide. Yesterday, the market cracked through the 200-DMA for the first time since last April. In fact, as shown, it was a 214 day stretch above the 200-DMA for the S&P 500.
What History Says After the 200-Day Break
The 200-day moving average is one of the most widely followed technical levels in markets, and for good reason. When the S&P 500 loses that line, the statistical evidence since 2000 is not comforting for bulls hoping for a quick recovery.
Going back through the seven identifiable sustained breakdowns of the 200-dma since 2000, the data tells a consistent short-term story: the first month is almost universally negative. Not once across all seven events we looked at did the market post a gain in the month following the break. The average one-month return is -5.3%, and the best single outcome was only -0.8%. That is not a rounding error. That's a pattern.
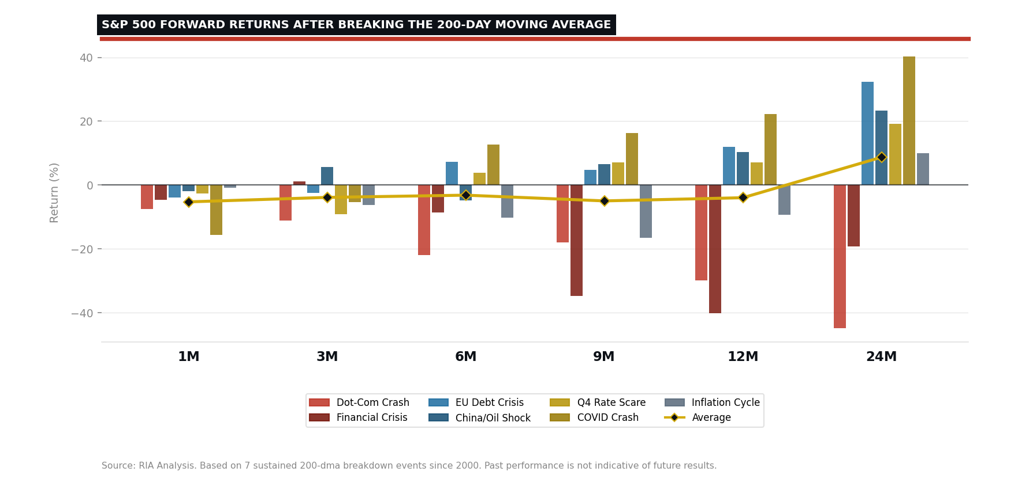
The picture does not improve much at three and six months. Two-thirds of the three-month windows ended in the red, with an average decline of -3.9%. Six months out, positive outcomes finally show up, but the distribution is everything. The COVID recovery (2020) and the EU crisis rebound (2011) pull the averages up sharply. Without them, the picture is considerably darker. The 2000 and 2008 events remind investors that when the macro backdrop is genuinely deteriorating, the 200-dma break is a warning, not just noise.
The medium-term picture does improve. At 9 and 12 months, more than half of the periods turned positive, and the median return flipped to a gain of +7.0% at 12 months. At 24 months, 71% of periods were positive, with a median return of +19.2%. The long-term recovery argument is real, but investors earned those returns by sitting through average drawdowns that frequently exceeded 15 to 20 percent first.
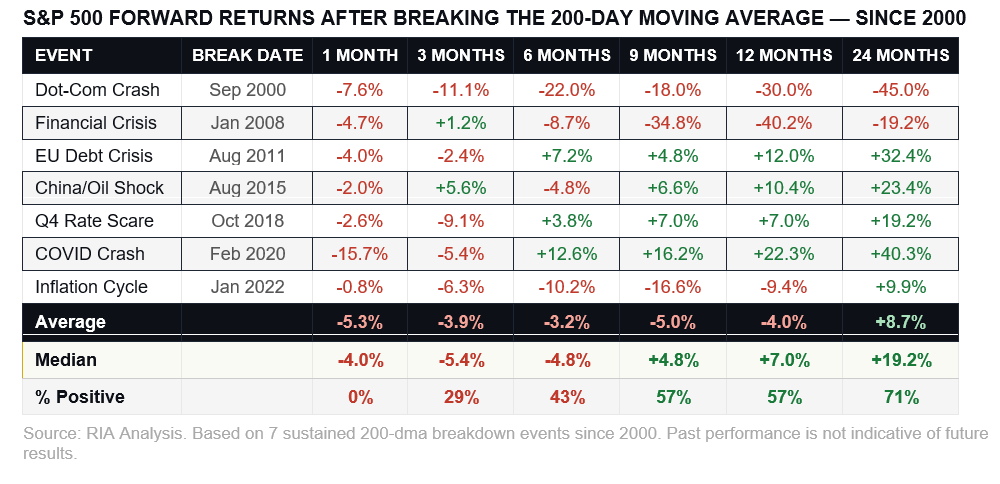
The honest read here is that breaking the 200-dma rarely marks the low. It usually marks the beginning of a process.

Assessing Private Credit Stress
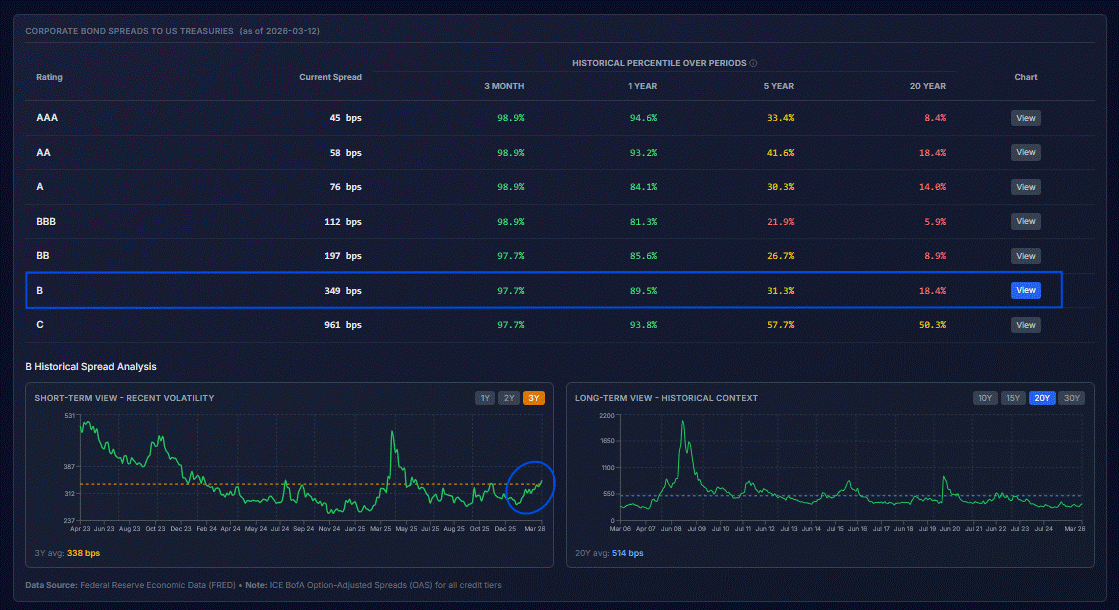
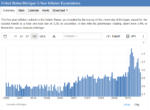
Following the posting of our article, Private Credit Stress, we received a few emails asking how to track private credit funds. Obviously, the media and its recent barrage of headlines about redemption gates and credit losses is a helpful start. Beyond the media, there are a few market sources worth tracking. One such indicator of credit is the spread between junk bond yields and US Treasury yields. In the first screenshot below, courtesy of the soon-to-be-released new version of SimpleVisor, junk spreads have widened, but as shown in the bottom-right graph, over the longer term, the uptick is not very noticeable. Corporate spreads can be helpful to a degree, but they can be very misleading, as there is significantly more liquidity in the bond markets than in private credit markets.
We can also follow the stocks of publicly traded Business Development Corporations (BDCs). BDCs are investment companies that lend money to smaller and medium-sized businesses. Their clientele and line of business are very similar to those in the private credit space. However, because the BDCs are liquid, they can serve as both a monitor and a hedging vehicle for private credit funds and other investors. Therefore, their prices will be impacted by more than just the credit status of the loans underlying the BDCs.
To help us follow BDCs, we created an equally weighted portfolio of the top BDCs in SimpleVisor. For those subscribed to SimpleVisor, you can create your own BDC portfolio in the My Portfolio section within the Portfolios tab. The third graphic below shows the performance of the BDCs we included in this tracking portfolio since January 2025.


Tweet of the Day

“Want to achieve better long-term success in managing your portfolio? Here are our 15-trading rules for managing market risks.”
Please subscribe to the daily commentary to receive these updates every morning before the opening bell.
If you found this blog useful, please send it to someone else, share it on social media, or contact us to set up a meeting.
The post The Bear Market Hiding Beneath The Calm Surface appeared first on RIA.
Full story here Are you the author?You Might Also Like
2026-02-21
🔎 At a Glance 🏛️ Market Brief – War With Iran On Friday, the Supreme Court struck down Trump’s signature tariffs. The ruling affects tariffs levied under the International Emergency Economic Powers Act (IEEPA) which includes the so-called reciprocal tariffs at various levels against nations all around the world to address trade imbalances, as well …
 Time To Swap Gold For Bitcoin?
2026-02-17
The dollar-debasement narrative is in full swing, as evidenced by the price of precious metals. However, one look at bitcoin, which should also rally on the debasement narrative, tells you something is amiss. We do not buy into the dollar-debasement narrative; instead, we believe much of the activity in gold and bitcoin is more closely …
 The Value Rotation Illusion
2026-02-11
“Value is back in vogue”, the media claim. Investors are rushing out of the high-flying mega-cap tech stocks and into the boring staples, utilities, and healthcare stocks. Given the huge outperformance of value stocks versus growth stocks, it appears investors are going all in on the value rotation. What some of these investors don’t know …
 The Seen And The Unseen Of QE-RMP
2025-12-22
In 1850, Economist Frederic Bastiat famously wrote an essay entitled “That which is seen, and that which is not seen.” The first chapter, “The Broken Window,” argues that good economics requires considering not just the immediate, visible effects of an action but also the delayed, less obvious (unseen) consequences. Unfortunately, most commentators, when asked about …
 Tariffs Are On The Docket: Will SCOTUS Upset The Market?
2025-11-05
The Supreme Court (SCOTUS) will begin hearing arguments challenging President Trump’s use of tariffs. Given the market volatility that tariffs have generated over the last six months, the SCOTUS case could prove to be yet another market-moving event. The tariff challengers argue that the administration overstepped its bounds under the 1977 International Emergency Economic Powers …
 Gold Or Bitcoin: Which Is The ‘Right’ Dollar Hedge?
2025-10-28
Gold and bitcoin are touted as the “anti-dollar”, or in some people’s minds, possible replacements for the US dollar. Thus, one would expect the dollar-debasement trade to benefit gold and bitcoin similarly. The reality throughout this year has not been what many would expect. For example, gold is up over 50% this year, while bitcoin …
Tags: Featured,newsletter