The dollar-debasement narrative is in full swing, as evidenced by the price of precious metals. However, one look at bitcoin, which should also rally on the debasement narrative, tells you something is amiss. We do not buy into the dollar-debasement narrative; instead, we believe much of the activity in gold and bitcoin is more closely related to speculative flows. Given our view, we think of both as trading vehicles and not hedges against calamity. Thus, the question we raise is whether this is the right time for gold holders to swap for bitcoin. To help time such a swap from gold to bitcoin, we use technical analysis of the bitcoin-to-gold price ratio, annotations, and a few bullet points to show you what we see.
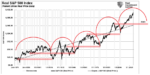
- Trend lines: The shorter-term green trend line, which supported bitcoin over gold for three years, gave way late last year. This was the first sign the ratio could reverse its upward trend. The ratio is now resting on a longer-term trend line (red). We suspect this line has a better chance of supporting the ratio.
- Head and shoulders: The three yellow dots indicate an upward-sloping head and shoulders. The distance (200) from the head to the neckline (green) equates to the expected decline from this pattern. The orange-dotted arrows indicate that the current ratio has reached its target.
- The RSI, MACD, and 100-day Rate of Change (ROC) are all extremely oversold.
The prices of gold and bitcoin are extremely volatile. Therefore, those wanting to time a swap from gold to bitcoin must exercise caution. Moreover, while the trends and indicators point to a reversal, the narrative remains strong, and the divergence between gold and bitcoin can certainly persist.

What To Watch Today
Earnings

Economy

Market Trading Update
Yesterday, the markets were closed in observance of Presidents' Day. Therefore, let's review where the market ended on Friday and the setup for this coming week. Overall, the S&P 500 continues to fail at previous all-time highs and has shifted toward distribution in recent weeks. Price pushed to a new intraday high last Monday at 6,980.10, then reversed into the close and spent Tuesday and Wednesday stalling near 6,941. That sequence matters because it left a clear supply shelf under the prior peak and set the stage for the selloff on Thursday as buyers failed, and sellers pressed the tape into the close, ending at 6,832.76, a 1.6% drop and the second-worst day since Thanksgiving, according to the Associated Press market recap. Then, on Friday, that market attempted a rebound but faded into the close, keeping prices below the broken shelf near 6,940 and closing at 6,836.17. As such, the bounce reads as corrective, not trend repair.

Overall, the market has remained in a broad consolidation pattern since last October, and February is returning to its statistical nature of weakness. While the market remains close to all-time highs, there has been a vicious rotation from growth to value. Looking at the market on a technical basis, the Thursday selloff broke support at both the 20- and 50-day moving averages, as money flows turned negative. Momentum and relative strength continue to decline, suggesting that buyers are becoming more scarce, at least in the near term. The selling pressure remained mostly contained to Megacap names, which is what pulled the broader index lower, but the rotation from growth to value is getting very extended.

Volatility has also been steadily rising, but so far it remains relatively contained. Technically, the key is the 6,940 to 6,975 band, which is the prior close cluster and the breakdown launch zone. If the index reclaims that area and holds it, the path opens back toward 6,980 and the 7,000 handle. If price fails there, rallies invite sellers, and the market stays range-bound, potentially heading to lower levels. Currently, support sits at 6,790 to 6,825, defined by Thursday’s low and Friday’s undercut and reversal. A clean break below that band increases the odds of a move toward 6,780, then 6,720. Next week is also shortened by the Presidents Day market closure on Monday, February 16, which often amplifies moves around well-defined levels.
| Support Or Resistance | Price Level | Description |
|---|---|---|
| Support | 6,790 to 6,825 | Prior swing low reference. The next downside target is 6,790 if it breaks. |
| Support | 6,812 | 100-Day Moving Average |
| Support | 6,550 | Larger swing low reference. Downside magnet if support fails. 200-DMA is the last line of defense at 6,504. |
| Resistance | 6,894 | 50-DMA that was broken on Thursday |
| Resistance | 6,914 | 20-DMA was broken on Thursday |
| Resistance | 6,980 to 7,000 | Weekly high area and psychological ceiling. |

The Week Ahead & CPI
CPI was slightly better than expected. The monthly core CPI rate was 0.3% as expected, but the inclusive CPI was 0.1% better than expectations at 0.2%. The year over year CPI rate fell to 2.4% from 2.7% last month. The graph below, courtesy of Bloomberg, shows the primary contributors to the CPI calculation. Core services constitute the large majority of CPI, and as shown, they are starting to decline. This is a promising trend that, if it continues in time, should help CPI reach the Fed's 2% target sooner than expected.
This holiday-shortened week will be much quieter on the economic front than last week. The FOMC minutes on Wednesday will likely show the Fed is in no hurry to lower rates. That said, it will be interesting to see if they mention the divergence between Truflation and CPI. PCE Prices will be released on Friday. Current expectations are in line with Friday's CPI data.

Financial Nihilism & The Trap Young People Are Walking Into
The article from the Wall Street Journal titled “Why My Generation Is Turning to Financial Nihilism” by Kyla Scanlon argues that Gen Z is embracing high-risk financial behavior out of despair and detachment. Of course, it is essential to recognize that Kyla, although well-intentioned, is a young twenty-something influencer with limited real-life experience, and sees things for “her generation” through a very narrow lens of “recency bias.”
Let’s start with understanding that “Financial Nihilism” is a term used to describe an attitude where people believe financial decisions are meaningless because the system is rigged, the future is hopeless, or traditional paths to wealth are broken. The term “Financial Nihilism” was first coined in 2020 by Demetri Kofinas, a podcaster, who used it to describe his belief that speculative assets lack intrinsic value, driven by a loss of faith in traditional economic systems.
However, while this phrase has gained popularity in recent years, particularly following the GameStop short squeeze, crypto mania, and the rise of meme trading, it disappeared when all of that collapsed in 2022. However, after three years of unprecedented market gains in every asset class, from stocks to cryptocurrencies to precious metals, “Financial Nihilism” has resurfaced to rationalize “speculative excess” and justify abandoning long-term investment strategies that have withstood the “sands of time.”
While Kyla produced a bombastic article to gain social media exposure by suggesting that Gen Z and Millennials no longer believe in saving, investing, or following traditional financial paths, the data shows something very different.
- Over half of Gen Z holds investments in traditional financial products, according to FINRA and the CFA Institute.
- A 2023 Vanguard report showed Gen Z participants in retirement plans were increasing contributions, not fleeing traditional investing.
- Charles Schwab’s Modern Investor Study found Gen Z prefers low-cost ETFs and index funds, strategies built around long-term returns.
- Pew Research data shows that Gen Z and Millennials are investing at earlier ages than previous generations.
None of these behaviors is nihilistic. They are practical and reflect economic constraints, not philosophical despair.
Tweet of the Day
“Want to achieve better long-term success in managing your portfolio? Here are our 15-trading rules for managing market risks.”
Please subscribe to the daily commentary to receive these updates every morning before the opening bell.
If you found this blog useful, please send it to someone else, share it on social media, or contact us to set up a meeting.
The post Time To Swap Gold For Bitcoin? appeared first on RIA.
Full story here Are you the author?You Might Also Like
 The Reflation Narrative Stumbles Out Of The Gate
2026-01-26
With a 4.4% increase in economic growth in the third quarter and expectations that it could be higher in the fourth quarter, the so-called reflation narrative appears primed to dash out of the gates in 2026 at its current strong pace. The problem with assuming the reflation narrative will hold in 2026 is that it …
 The DPI Link To Margin Debt
2025-12-08
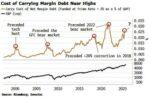
A recent article by Simon White, via Bloomberg, discussed the rising cost of margin debt for investors. While his analysis below compares the cost of debt to GDP, we will also consider a more critical comparison to disposable personal income (DPI). Here is Simon’s point. “Yet, where history does raise a red flag is if …
 Jobs Data From Alternative Sources May Drive Fed’s Next Move
2025-12-05
With the federal government shutdown delaying critical economic reports, the official jobs data remains incomplete. Last week, the Bureau of Labor Statistics (BLS) released the September jobs report. However, the October report, originally expected earlier this month, remains in limbo, potentially permanently. The reason is due to the shutdown, as the BLS was unable to …
 A Bear Market Is A Good Thing.
2025-12-01
One of my favorite writers for the WSJ is Spencer Jakab, who recently penned an article explaining why a bear market is not necessarily a bad thing. He starts with a quote from “The Godfather.” ““These things gotta happen every five years or so, ten years. Helps to get rid of the bad blood…been ten …
 Is QT On Its Last Lap?
2025-10-16
Chairman Powell spoke on Tuesday, addressing several topics. Of note was the following quote: “We may be approaching the end of our balance sheet contraction in the coming months.” The market interpretation is that QT is ending soon. As a reminder, QT, also known as quantitative tightening, has been in effect for over three years. …
 OpenAI: Fueling Massive AI Stock Gains
2025-10-08
As we led in yesterday’s Commentary, AMD rose 25% on the news that OpenAI would purchase 10% of AMD. In exchange, OpenAI will become a significant customer of AMD. This symbiotic relationship is just one of many that OpenAI is forming with companies at the forefront of the AI revolution. The bullet points and graphic …
Tags: Featured,newsletter