As we wrote in yesterday's Commentary, efficiently rotating between overbought and oversold sectors, factors, or stocks is a well-established method for outperforming markets. Like any strategy, the hard part is timing, or properly estimating when a pair of sectors, factors, or stocks is about to reverse their respective trends. Currently, there is a massive divergence between software stocks and consumer staples. Thus far in 2026, the software ETF, IGV, is down 20%, while XLP, the consumer staples ETF, is up 12%, and the S&P is flat for the year. Is it time to sell staples and buy software?
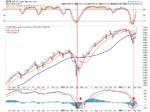
To help us better appreciate the relationship and how it may trade, we share three graphics below. The two graphs on the left show that call volume in the software sector is spiking to unprecedented levels, and put volume on staples is surging too. Speculative investors or hedgers are clearly betting that the performance divergence between the two sectors will reverse.
With SimpleVisor, we can use technical analysis to assess our question. The graph on the right shows the price ratio (blue) of IGV to XLP. As shown, it has declined appreciably since November. Beneath the ratio graph is a proprietary technical momentum indicator that shows IGV is very oversold relative to XLP but has not triggered a buy signal, which would suggest that a reversal in the performance divergence is likely. Similarly, the bottom two graphs, the MACD and stochastics, also point to oversold conditions, but neither is triggering buy signals, albeit they are close. Bear in mind that, as with technical analysis of a stock or index, IGV doesn't have to outperform XLP; it only has to stop underperforming to bring the technical gauges back toward fair value.

What To Watch Today
Earnings
Economy

Market Trading Update
As noted, the markets started February on a sloppy note. Leverage unwound fast once volatility spiked, and selling pressure hit crypto first, then metals, then equities. The sequence mattered as gold and silver broke sharply after repeated CME margin hikes tied to extreme price swings. Higher margin requirements forced traders to raise cash as margin calls mounted, and the fastest way to do so was to sell liquid positions. That selling spread into bitcoin, where leveraged longs liquidated aggressively as prices sliced through technical support near 65,000. Equities followed as cross-asset risk reduction took hold. This looked mechanical, not emotional.
However, on Friday, buyers once again "bought the dip" at the 100-day moving average, pushing stocks above initial resistance at the 50- and 20-day moving averages. That move keeps the bull trend alive and well, and the market continues its consolidation that began in November. Notably, investors were busy rebuying everything that got sold this past week, including metals and crypto. Heading into next week, the market will have to contend with resistance at the previous highs. Furthermore, given the recent selloff, particularly in metals, was so sharp, I would consider reducing risk on rallies as "trapped longs" look to exit. The next bottom will likely prove to be more lasting.

While the media was full of headlines about why selling was so broad across markets, the more likely explanation was that metals and crypto cracked, and systematic and risk parity strategies reduced exposure. The Nasdaq absorbed most of the damage as high-multiple software and AI-related names led the decline. By Thursday, price action showed signs of forced selling, with intraday ranges widening and volume rising on down moves. These patterns align with margin-driven liquidation rather than discretionary positioning.
As noted, the change in tone on Friday was encouraging as the sharp rebound eased automated selling pressure. However, when forced sellers finish, prices often snap back quickly. Crucially, this does not signal a new uptrend, just a potential end to the first liquidation wave. There is now a much higher risk of another leg lower than a move higher. As such, traders should focus on levels, not narratives. Relief rallies fail often when resistance holds. Sustained upside requires volatility stabilization and tighter intraday ranges. If support holds early next week, consolidation becomes the base case. Failure at support opens the door for a second leg lower.
| Index/Level | Level (Approximate) | Notes |
|---|---|---|
| S&P 500 | 6932 | Friday's closing level |
| Immediate Support | 6927 | 20-day moving averge |
| Intermediate Support | 6885 | Rising 50-day moving average, structural trendline |
| Major Support | 6799 | 100-day moving average |
| Initial Resistance | 7000 | Psychological level, tested twice in January |
| Major Resistance | 7076 | 20-day moving average |

The Week Ahead
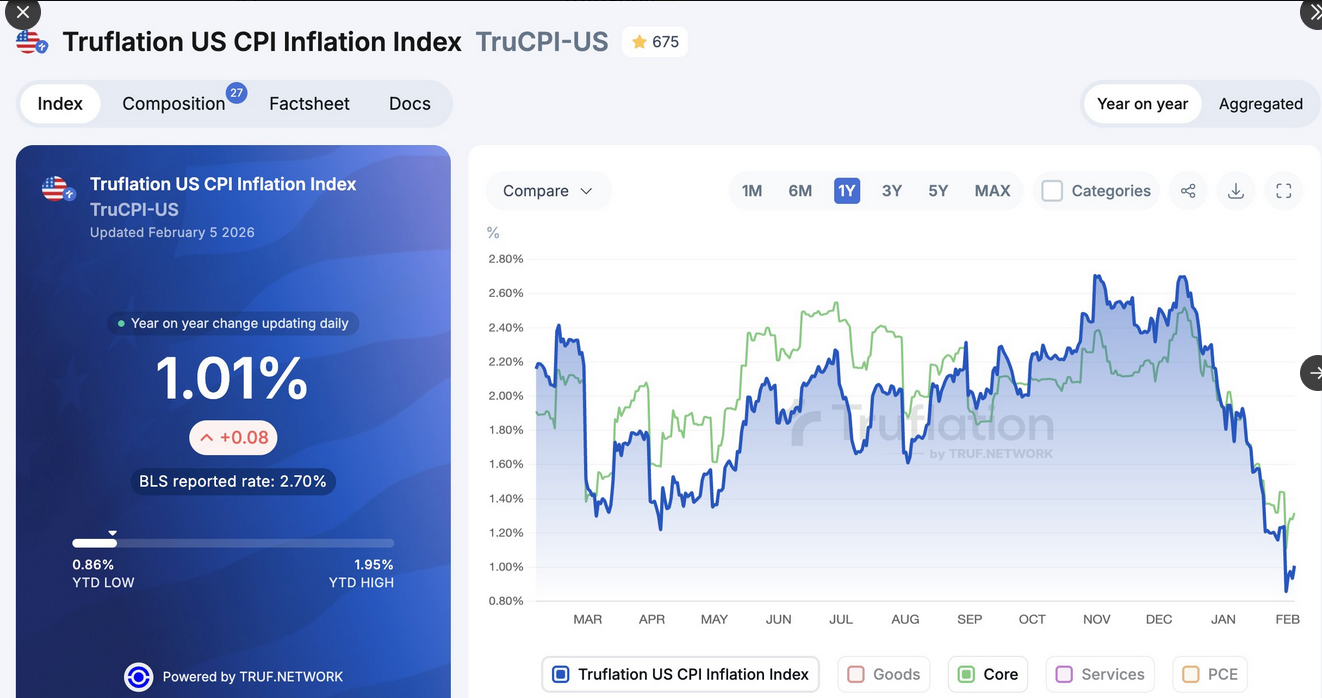
The economic calendar will be busy this week. Retail Sales on Tuesday will provide our first account of consumer activity after the holiday season. The following day, the BLS will release the delayed employment report originally due last Friday. Expectations are that 50k jobs were added last month. Unemployment is expected to tick up 0.1% to 4.5%. ADP data warn that the number could be lower than consensus expectations. On Friday, the BLS will release CPI. We are very interested in seeing whether the government's inflation data shows a similar sharp decline, as Truflation (shown below) did in January. It's worth adding that Friday's University of Michigan one-year inflation expectations fell from 4.00% to 3.50%.
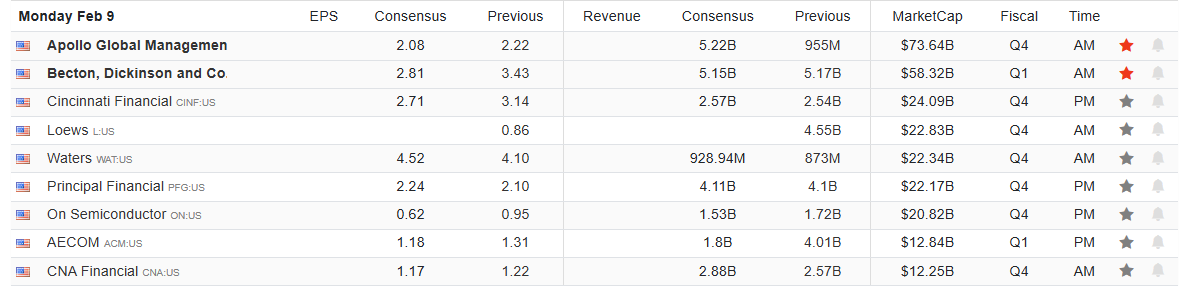
The earnings calendar slows down markedly this week. Of note are Coca-Cola, Duke Energy, and CVS on Tuesday, and McDonald's on Wednesday. The next key earnings report will be Nvidia, which reports on February 25th.
The Reflation Narrative
The market got off to a strong start in 2026, with investors chasing industrials, materials, and commodity-related stocks as the reflation narrative gained traction. The “reflation narrative” is the belief that a range of policies will boost the rate of economic growth in the U.S. without triggering inflation. As I discussed at our recent 2026 Investment Summit, the markets are banking on the effects of the passage of the OBBBA, tax cuts, and deregulation to fuel earnings and profit growth in 2026.

Furthermore, the markets are focused on the Federal Reserve with expectations of further rate cuts and easing of monetary policy. All of these actions aim to increase consumption, investment, and employment, which in turn will increase wages and corporate revenues.
Over the last few months, the reflation narrative has re-emerged. After years of tightening by global central banks to tame post-pandemic inflation, the focus has started to shift. Inflation has moderated in the U.S., and growth remains positive, albeit soft in some sectors. Policymakers and market participants are watching for signs that rate cuts could soon be back on the table, particularly as employment softens.
Tweet Of The Day
“Want to achieve better long-term success in managing your portfolio? Here are our 15-trading rules for managing market risks.”
Please subscribe to the daily commentary to receive these updates every morning before the opening bell.
If you found this blog useful, please send it to someone else, share it on social media, or contact us to set up a meeting.
The post Software Or Staples? appeared first on RIA.
Full story here Are you the author?You Might Also Like
 The South Park Market Of 2026
2026-01-23
I have been a “South Park” fan for as long as I can remember, and while the show isn’t a market guidebook, its brutal satire cuts through nonsense better than many Wall Street commentaries. Just like on the show, characters make absurd decisions and face absurd consequences, which is familiar to investors today. For example, …
 Akademiker Pension Serves The US A Warning
2026-01-22
A Danish pension fund, Akademiker Pension, which manages roughly $25 billion in retirement assets for teachers, announced that it plans to sell all of its U.S. Treasury holdings by the end of January.
Tags: Featured,newsletter