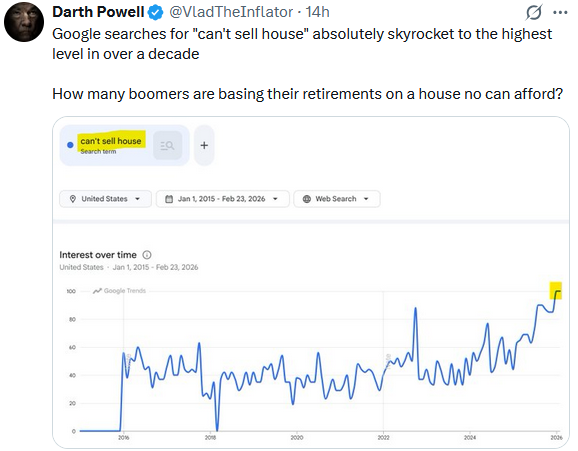
The housing market is experiencing a widening imbalance between homesellers and homebuyers, with listings rising faster than demand. This is contrary to the post-pandemic period of extremely tight inventory and strong demand. Homeowners with ultra-low mortgage rates who were initially hesitant to sell are now increasingly selling. As shown below, the housing market is shifting away from the homeowner-dominated conditions of the pandemic era toward one where supply is growing but qualified and willing buyers remain scarce. Rising inventory signals that pricing power is slowly shifting from homesellers to homebuyers.
More sellers than buyers does not necessarily imply a sharp decline in home prices, but it does change market dynamics. As we are starting to see, homes are staying on the market longer, price reductions are more common, and bidding wars are fading. Importantly, the imbalance reflects affordability constraints due to high prices and financing costs. Thus, demand is constrained despite decent employment prospects and stable household balance sheets. As shown by the red rectangles, periods with more homesellers than buyers were associated with a decline in the growth rate of home prices. Conversely, the green rectangle shows what happens when the number of homebuyers is much larger than the number of home sellers. Bottom line: expect home price growth to slow and possibly decline until there is a better balance between buyers and sellers. Please see the Tweet of the Day for more on the topic.

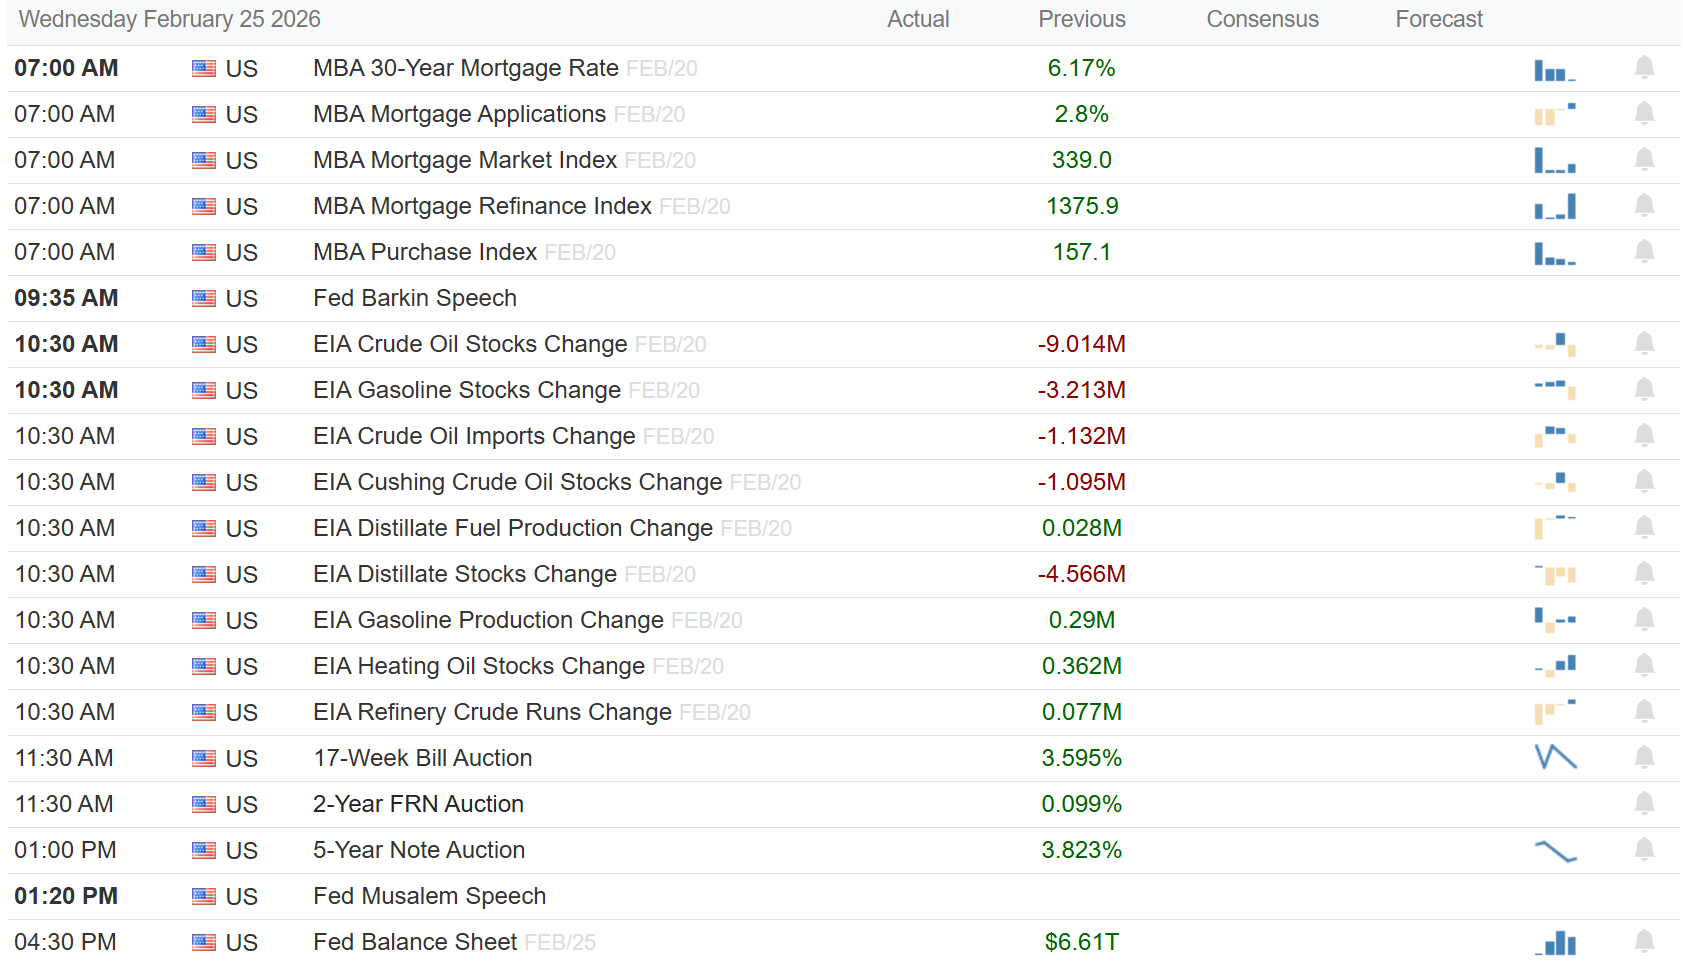
What To Watch Today
Earnings

Economy
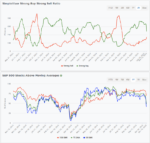
Market Trading Update
Yesterday, we discussed the substantial short interest in the S&P 500 index. Those shorts are fuel for a rally when one occurs. However, technically, the market looks weak, as shown in the chart below. Momentum continues to fade along with Relative Strength. Furthermore, the market has been making lower highs as of late and is threatening to break important support at the 100-day moving average.
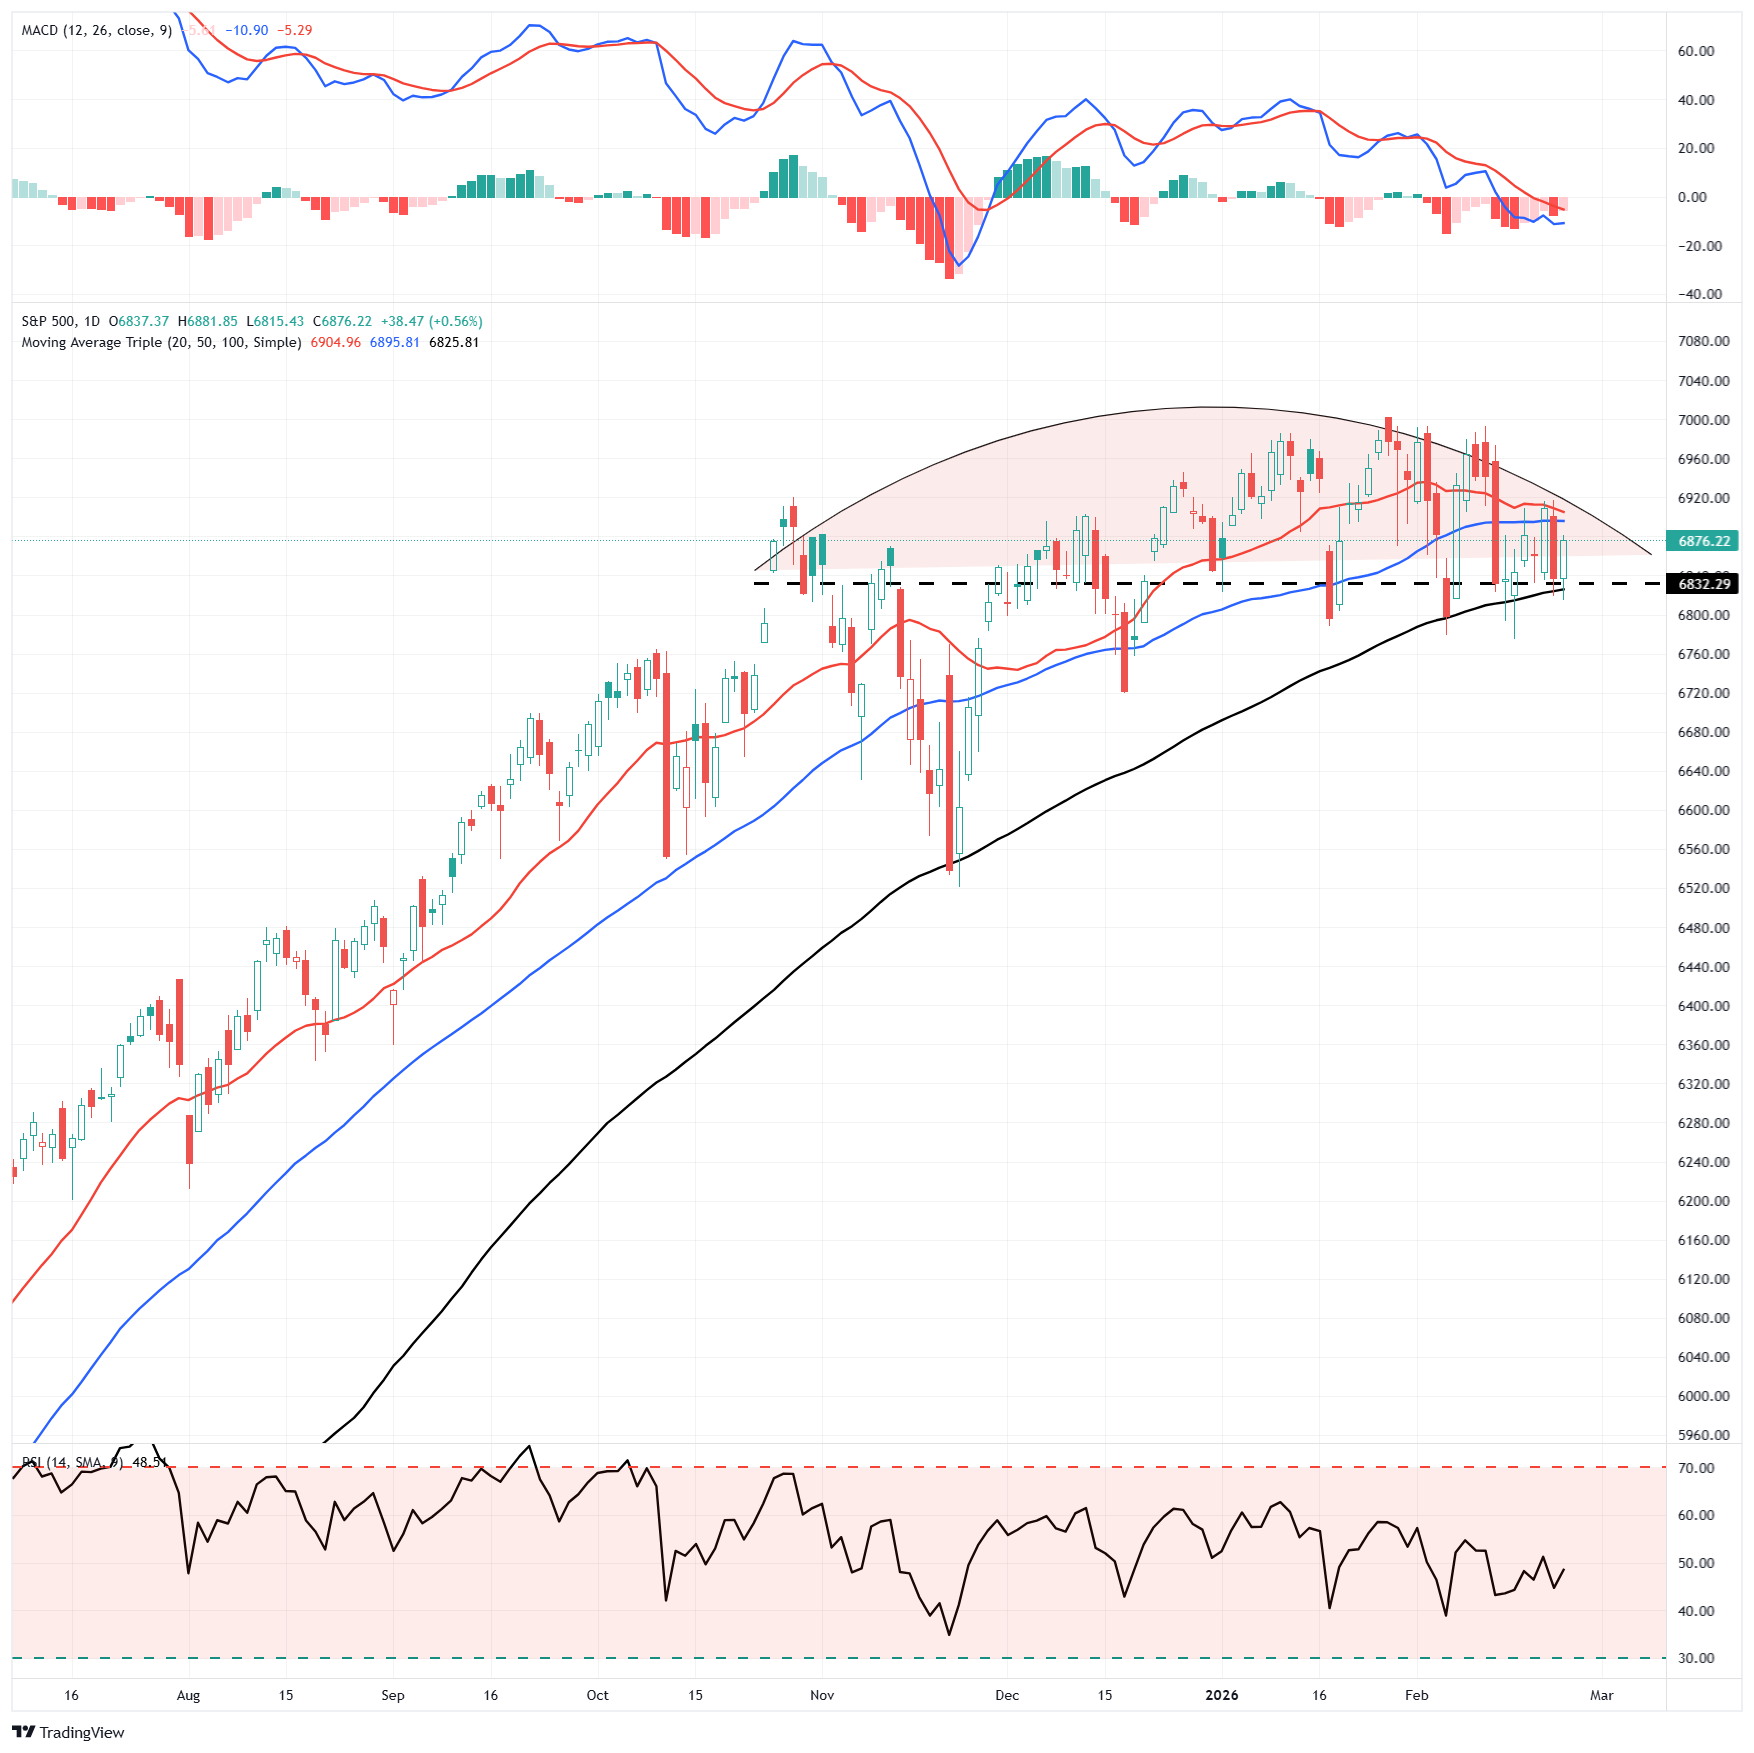
This does not mean the market is about to have a deeper correction; I just don't like the price action, particularly in the smaller sectors of the market that are extremely overbought and have deviated from their means. As Greg Feirman recently noted:
"While the S&P is only about 2% off its all time highs, beneath the surface the market is showing signs of a top. Warren Pies tweeted today that there have only been two other times when Consumer Staples and Energy have been up more than 10% and Technology and Financials negative over the previous 63 trading days: 1990 (Desert Storm) and 2000 – both of which were tops. Health Care – another defensive sector – has also been outperforming the S&P of late."
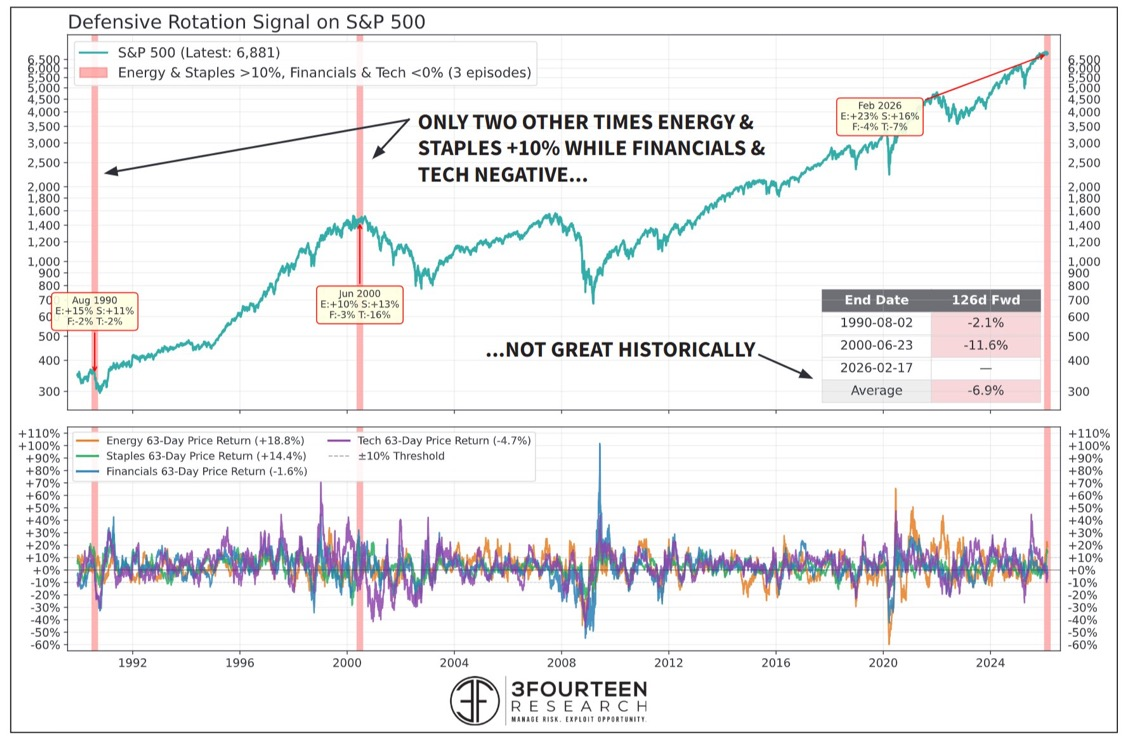
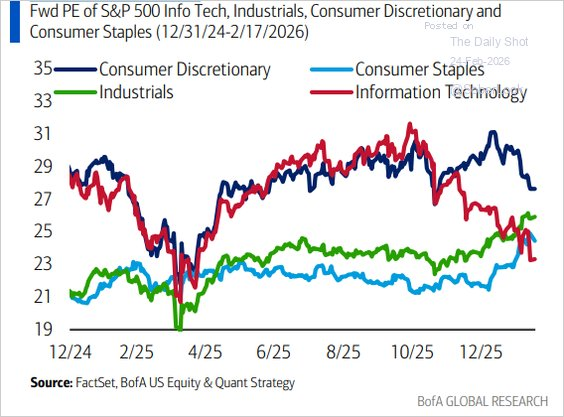
The problem with the current correction, is the deviation between those defensive names which are extremely overbought, and the growth names that are extremely oversold. However, those growth names are where the earnings and revenue growth reside. With that in mind, the next rotation could be from the defensive names back to growth names which are now trading significantly cheaper on a forward PE basis. Such a rotation would be exactly what often happens as no one currently expects it.

Bitcoin Is On The Verge Of A Bear Market
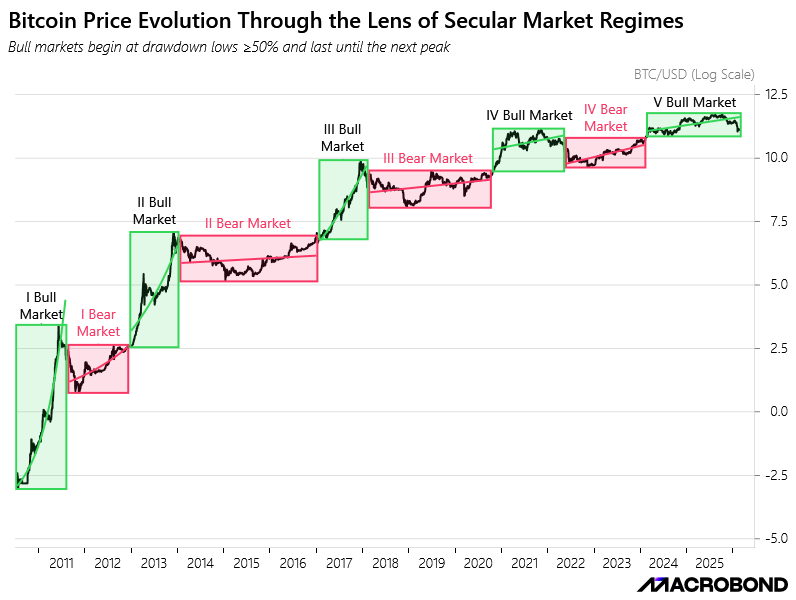
The traditional definition of a bear market for a stock or equity index is a decline of 20% or more from the peak. However, for crypto, a 20% decline is considered normal volatility. Therefore, many crypto analysts claim a 50% drawdown is the line in the sand between "normal" trading and a bear market.
Per the MacroBond graph below, Bitcoin’s recent decline is now around 40-45%, approaching the critical 50% bear-market level. If it were breached, it would effectively mark the end of the fifth bull market, which began in early 2024, and the start of a new bear phase.
Dollar
Over the last 9 months, the dollar has been consolidating within the blue rectangular area, as shown below. A bearish breakout of this range is potentially bullish for stocks and precious metals. However, a bullish breakout may limit speculative behaviors in equities and precious metals while pushing bond yields lower.
Currently, the dollar index is in the middle of the band. It is approaching its 200-day moving average, which may likely prove to be resistance. However, a breakout above the 200-day moving average and a higher high may signal a bullish break from the range. Further supporting a bullish view is the MACD buy signal and the rising RSI. The two technical indicators are close to forming a bullish divergence if they hit higher highs before the dollar index does. Stay tuned!

Tweet of the Day
“Want to achieve better long-term success in managing your portfolio? Here are our 15-trading rules for managing market risks.”
Please subscribe to the daily commentary to receive these updates every morning before the opening bell.
If you found this blog useful, please send it to someone else, share it on social media, or contact us to set up a meeting.
The post Homesellers Dwarf Homebuyers: Home Prices At Risk appeared first on RIA.
Full story here Are you the author?You Might Also Like
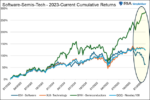 Software Stocks: Navigating The SaaSpocalypse
2026-02-25
The recent rotation from growth to value is well documented. While the return divergences between, for instance, technology stocks and materials or industrials stocks are significant, they do not tell the whole story. There are also extreme return differentials between broad industries and their sub-industries. In this article, we address one such divergence between the …
 Stagnation Is Lulling The Fed To Sleep
2026-01-09
The JOLTs data released on Wednesday paint a picture of labor market stagnation. The graph below shows that the number of job openings has fallen to levels similar to those right before the pandemic. While the number of openings seems somewhat stable, layoffs are slowly increasing, while new hires are near a 15-year low. Similarly, …
 Precious Metals Aren’t Predicting Economic Collapse
2026-01-05
In 2025, the prices of precious metals rose sharply, with silver prices recently surging past $80 per ounce. Of course, when precious metals rise, there is always the same group of commentators (mostly paid newsletter writers and physical metal dealers) to declare that a financial breakdown is underway. Articles like those published on ZeroHedge by …
 Nvidia’s Cash Strategy Reflects Regulatory Landscape
2026-01-02
Nvidia’s explosive growth has created a new challenge: how to deploy an unprecedented amount of cash in a world where scale itself has become a regulatory constraint. The chart below, from The Wall Street Journal, illustrates Nvidia’s massive free cash flow growth. However, traditional uses of its cash, such as large acquisitions, are increasingly difficult …
 Is Strategy Dragging Bitcoin Down?
2025-11-17
Bitcoin is up 2% year to date, but the share price of the world’s largest holder of Bitcoin, Strategy (MSTR – formerly MicroStrategy), is down about 30% year to date. As we have noted in the past, Strategy is a Bitcoin holding company, a leveraged alternative to holding Bitcoin. Its original business, enterprise analytics software, …
2025-11-12
Here we go again. The overnight funding markets are showing signs of stress, and the scent of QE is in the air. Per New York Fed President John Williams: Based on recent sustained repo market pressures and other growing signs of reserves moving from abundant to ample, I expect that it will not be long …
2025-11-11
Buckle Up! With the end of the government shutdown and the return to work of government employees comes a flood of economic data. Below is a list of old economic data that should be released over the coming weeks: The list goes on. But, of more importance is whether or not the markets will care …
Tags: Featured,newsletter