In 2015, Google wrote a $900 million check to SpaceX for a roughly 7.5% stake in Elon Musk's budding aerospace/rocket company. At the time, SpaceX was valued at $12 billion. Ten years later, Google’s early investment in SpaceX is now being framed as a great trade, not just because of the massive profit it will generate, but also because of the strategic benefits it will afford Google.
SpaceX recently announced plans to go public at a target valuation of $1.5 trillion. At that valuation, Google's $900 million stake will be worth $112 billion. For context, Google's latest annual income was $98 billion. A 125x return over ten years is incredible; the strategic foresight is equally powerful. As AI models grow more complex, the need for energy to power data centers is increasingly the binding constraint. Data centers already strain power grids, water resources, and local communities. One answer to the shortcomings of the power grid is space-based data centers. SpaceX, with 7500 satellites in orbit, has demonstrated its ability to deploy data centers in space. The benefit of space-based data centers is that solar power is much more efficient than on Earth. Consider the following excerpt from Travis Beals, Senior Director, Paradigms of Intelligence:
The Sun is the ultimate energy source in our solar system, emitting more power than 100 trillion times humanity’s total electricity production. In the right orbit, a solar panel can be up to 8 times more productive than on earth, and produce power nearly continuously, reducing the need for batteries. In the future, space may be the best place to scale AI compute.
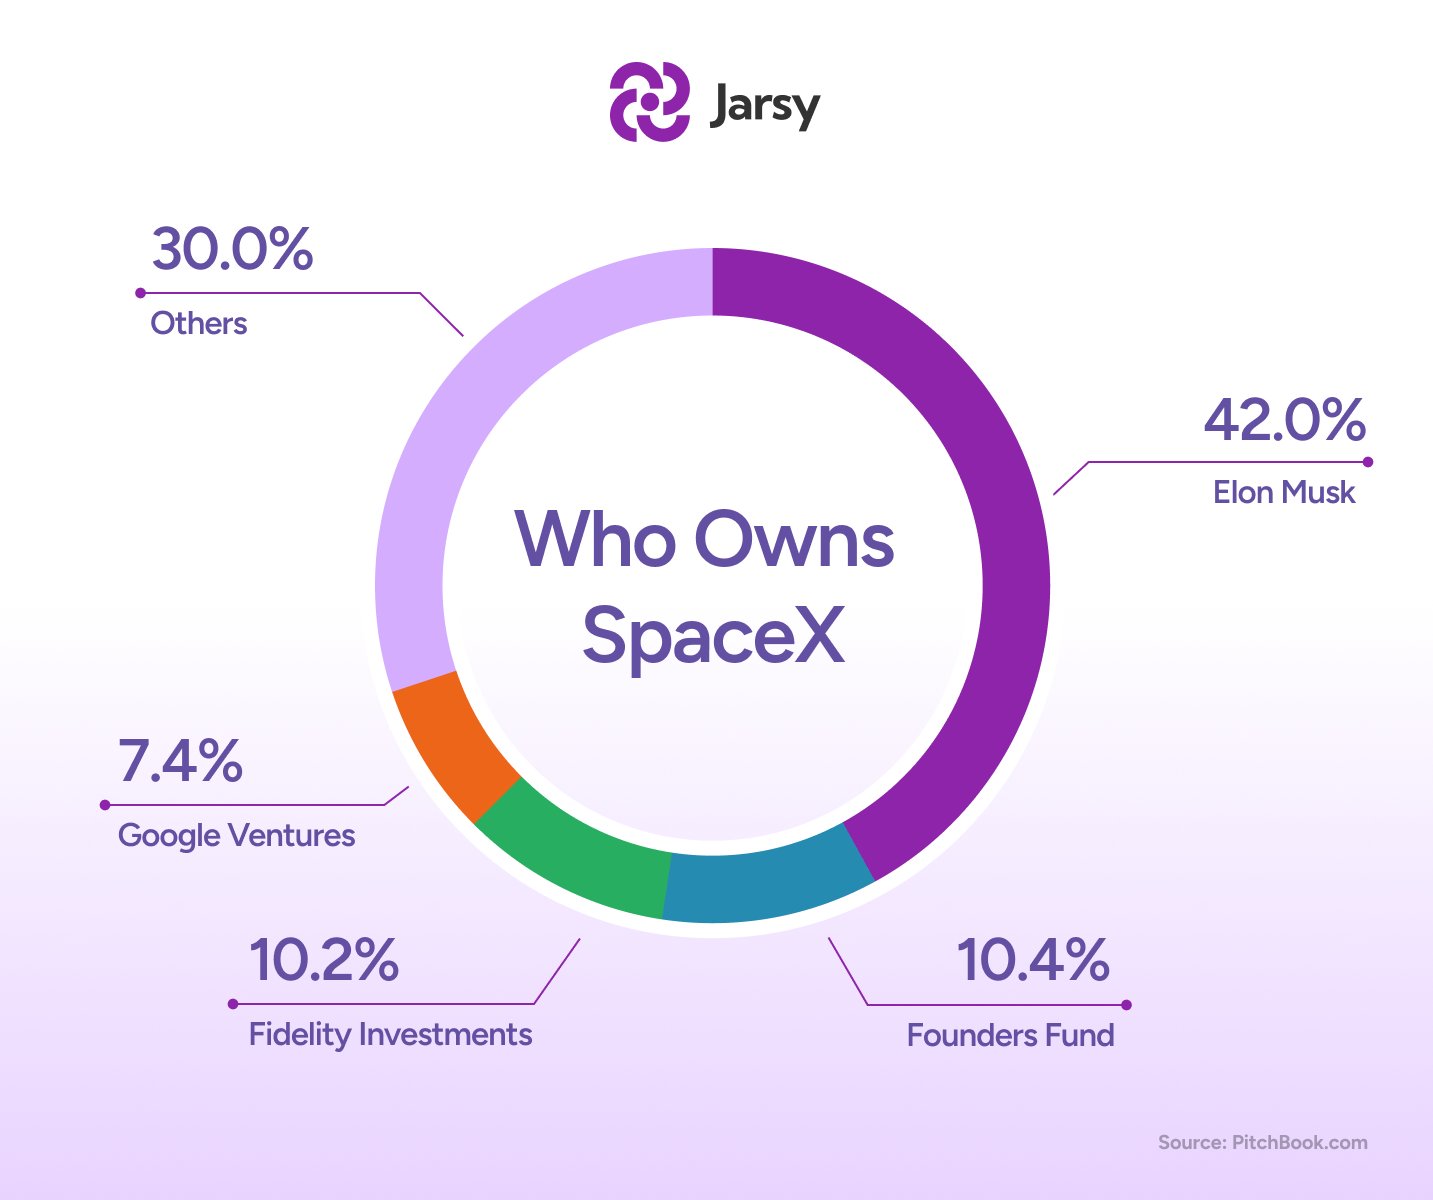
SpaceX was never just a financial investment; it was a bet on solving AI’s future resource problem. Space offers effectively unlimited solar energy, passive cooling, and freedom from land and water constraints that are currently highly problematic for hyperscalers. Google's strategic and financial investment success demonstrates that it is effectively aligning capital, infrastructure, and long-term compute needs. The graph below, courtesy of Jarsy, shows the composition of SpaceX investors.
What To Watch Today
Earnings
- No earnings releases today
Economy

Market Trading Update
Friday, we discussed forward valuations and expected returns over the next 5 years. While that is an essential understanding, it means little for the market action next week. For that, we turn to technical analysis.
The S&P 500 closed the week at 6.847, holding its bullish trend structure and briefly breaking out to new all-time highs on Thursday. After a strong rally driven by a dovish Fed, the index pushed into the previously outlined resistance range of 6850–6900. That level had previously acted as a ceiling and is now a key technical pivot. Even with the push higher, volume has been light on recent rallies, and momentum indicators, such as the RSI, suggest the rally is losing steam. However, despite ongoing concerns about mega-cap stocks, the broader uptrend remains intact.

The index remains solidly above both its 50-day and 200-day moving averages. The collision of the 20- and 50-day averages, which was reclaimed following the October correction, now serves as immediate support. Should the market lose this area, the next crucial demand zone sits near 6,635, which is the 100-day moving average. Just below that level is “crucial support” at the 100-day moving average. That level marks the bottom of the November retracement and will be critical to watch if downside pressure builds. A more pronounced decline would bring the 200-day moving average, now near 6,236, into play, and would represent a significant shift in market character if it were tested.
On the upside, bulls need a clear break and close above 6,901 to confirm the recent breakout to new highs. If they succeed, the next resistance zone lies between 7,070 and 7,100, which is the top of the current trend channel. That is where markets would become increasingly deviated from their longer-term means. For now, the market is likely to remain range-bound until the year-end push following the Christmas holiday.
Key Technical Levels
Resistance:
- 6,850–6,900 (Current ceiling)
- 7070–7100 (Top of trend channel)
Support:
- 6,756 (50-day moving average zone)
- 6,628 (100-day moving average.
- 6,533 (November correction lows.
- 6,236 (200-day moving average)
Next week, focus will shift to whether the bulls can sustain momentum into year-end. Markets are entering a seasonal window where fund flows, tax positioning, and institutional rebalancing typically drive short-term direction. Watch for confirmation of a breakout above 6,900, accompanied by rising volume. If the price fails to hold above support at 6,756, it may trigger a deeper test toward the November lows, but this seems to be a lower-probability event currently. Sideways consolidation is the base case unless new catalysts emerge.

The Week Ahead
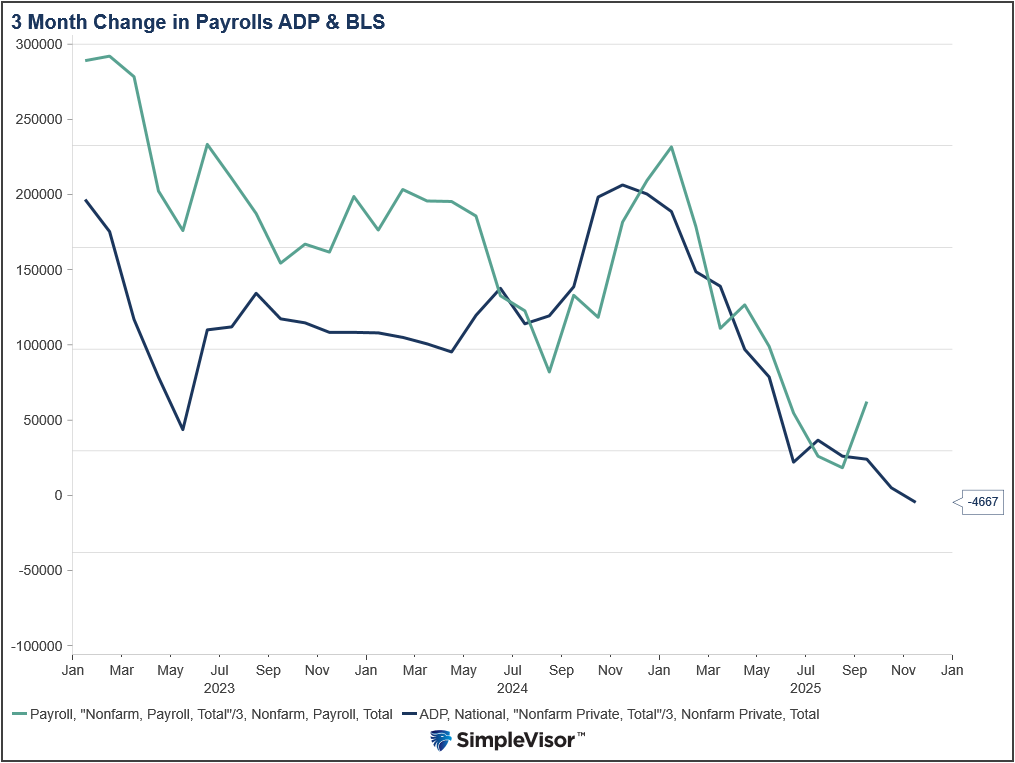
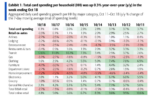
Government economic data will resume in earnest this week. On Tuesday, the BLS will provide the employment report. The current estimate is for a mere 25k job growth, with the unemployment rate sticking at 4.4%. The graph below compares current ADP data with lagging BLS employment data to help us appreciate the weakness that may likely show up in the unemployment report.
Also, on Tuesday, retail sales will be released. Assessing consumer health through retail sales is challenging this time of year due to fluctuations in holiday spending. Retail sales for the October-December period typically provide a clearer picture of consumer spending than single-month data. On Thursday, the BLS will release CPI. Current estimates are for a 0.3% increase, bringing the annual rate to 3.0%.
Given the divergent views of Fed members, we will get a good mix of hawks and doves, each articulating their economic views and how they impact their prescriptions for monetary policy.
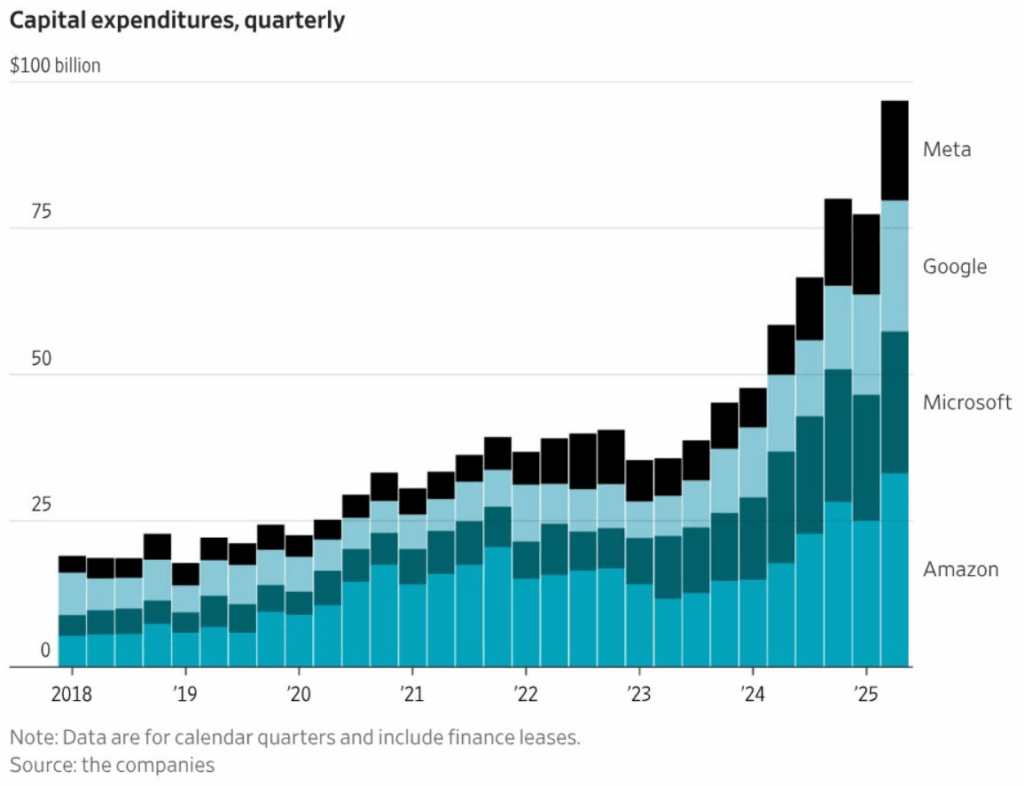
Does AI Capex Spending Lead To Positive Outcomes?
As someone who views corporate finance through a pragmatic lens, I’ve been closely watching the current surge in capital expenditures (capex) tied to artificial intelligence (AI). The question I’m addressing here is this: when a company spends massive amounts of free cash flow and takes on increasing debt, in this case for AI CapEx, does that lead to a positive outcome for investors? The short answer is that the answer is sometimes yes, but only under particular conditions. If those conditions are not present, the result can be negative. In this post, we will explore the historical context, provide examples, discuss the associated risks, and offer guidance on navigating the current environment.
Tweet of the Day
“Want to achieve better long-term success in managing your portfolio? Here are our 15-trading rules for managing market risks.”
Please subscribe to the daily commentary to receive these updates every morning before the opening bell.
If you found this blog useful, please send it to someone else, share it on social media, or contact us to set up a meeting.
The post SpaceX: A Financial And Strategic Windfall For Google appeared first on RIA.
Full story here Are you the author?You Might Also Like
 Repo Market: Critical Warning Or Bullish Signal
2025-11-08
🔎 At a Glance 💬 Ask a Question Have a question about the markets, your portfolio, or a topic you’d like us to cover in a future newsletter? 📩 Email: [email protected]🐦 Follow & DM on X: @LanceRoberts📰 Subscribe on Substack: @LanceRoberts We read every message and may feature your question in next week’s issue! 🏛️ …
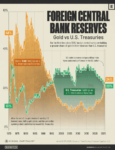 Gold Myths Luring Investors Into Risk
2025-10-31
In case you haven’t heard, precious metals, particularly gold, have risen sharply this year. Of course, whenever any asset class experiences a more speculative melt-up, investors are quick to rationalize why “this time is different.” In stocks, it is about “artificial intelligence” and “data centers.” The cryptocurrency community believes all fiat currencies will fail and …
 Retail Leverage Goes to Extremes
2025-10-25
🔎 At a Glance 💬 Ask a Question Have a question about the markets, your portfolio, or a topic you’d like us to cover in a future newsletter? 📩 Email: [email protected]🐦 Follow & DM on X: @LanceRoberts📰 Subscribe on Substack: @LanceRoberts We read every message and may feature your question in next week’s issue! 🏛️ …
 Beyond Meat Surges: Another Meme Ponzi?
2025-10-23
In August 2025, Beyond Meat (BYND), a plant-based meat producer, took to social media to call reports of its bankruptcy “unequivocally false”. Despite the assurances, the company was floundering, and bankruptcy was a possibility. The company has significant liabilities and has lost money every year since its IPO. Adding to their woes, sales peaked in …
Tags: Featured,newsletter