GDP, released on Tuesday, showed that the economy grew by a larger-than-expected 4.3%. Powering the strong economic growth was personal consumption, which rose by 3.5%. Consumers are spending!. What's unusual about that statement is that consumer sentiment remains historically weak. Typically, there is a strong correlation between personal consumption and consumer sentiment. As we share below, the University of Michigan and the Conference Board consumer sentiment indexes are at or near 10-year lows. Moreover, they are generally worsening, yet personal consumption continues to grow strongly.
Can such a divergence continue? To help answer that, consider the five bullet points below, which explain why personal consumption has been strong.
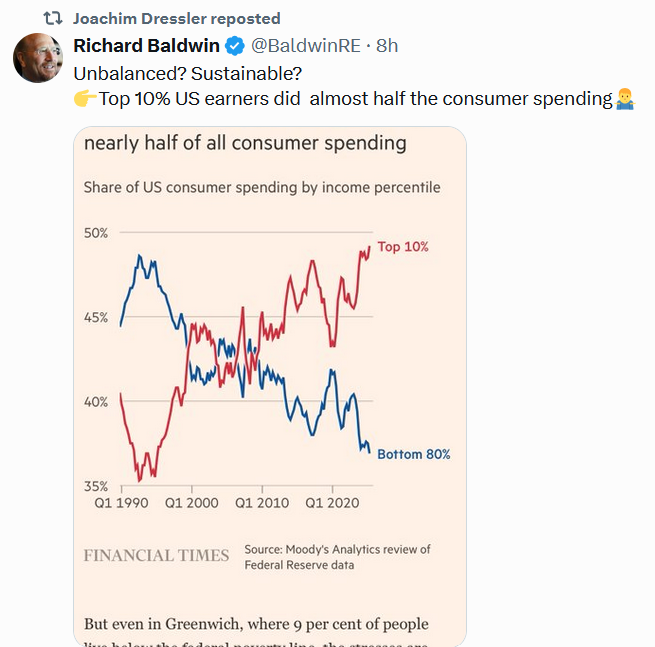
- Wealth Effect: U.S. stock markets will post their third 20%+ increase in a row.
- Non-discretionary Spending: The mix of spending is leaning towards non-discretionary items. For instance, spending on housing, healthcare, insurance, and travel is increasing as a share of total spending. Many of these expenditures are unavoidable, not confidence-driven impulse purchases. For example, healthcare spending accounted for nearly 20% of consumption.
- Credit: Rising use of credit cards, buy-now-pay-later, and home equity loans boosts spending in the short term.
- Savings: Real personal income was flat, thus consumers are using savings, which fell to a historically low 4.7% rate, or credit to meet their needs. Neither is sustainable over the longer run.
- Inflation: Even if the inflation rate is normalizing, the higher prices of goods and services weigh on consumers' psyche, in turn making sentiment worse. However, its impact on consumption is not as significant.
Please see the Tweet of the Day below for a further explanation.

What To Watch Today
Earnings
- No notable earnings releases
Economy

Market Trading Update
The technical picture for U.S. equity markets remains bullish but precarious as the year draws to a close. Major indexes are trading near key highs, but momentum indicators and price structure suggest caution in the near term.
The S&P 500 continues to hover just under all‑time highs, reflecting the Santa Claus rally, as the index reached fresh record levels earlier in the week before pulling back modestly in thin post‑holiday trading. The S&P 500’s proximity to prior highs has created a critical technical inflection point. The 7,000 level remains a key target for the markets to trade toward, and with markets just 80 points away, the goal could be reached early next week.
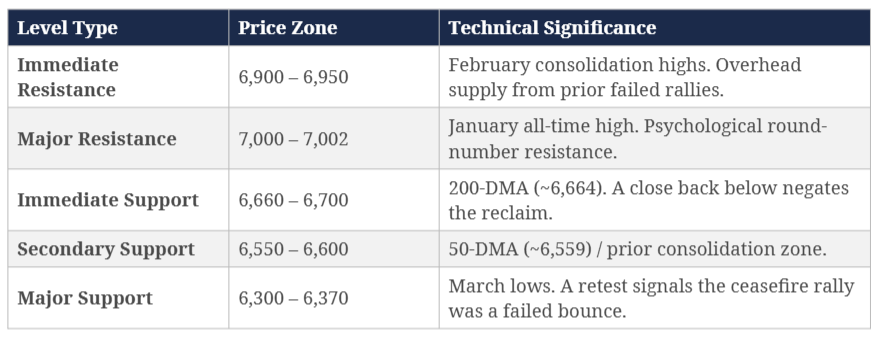
Support for the S&P 500 is situated in a confluence zone between 6,850 and 6,880, an area that capped recent rallies and served as resistance before the brief breakout. Should price fall back below this area, the next significant cushion lies nearer the 6,760–6,780 range. A break below that zone would suggest weakening internal breadth and could signal a deeper pullback toward mid‑December support levels in the 6,600s. Updating our chart from last week, we see the minor breakout above previous all-time highs, and the triggering of a fresh momentum "buy signal," which is also supportive heading into next week.
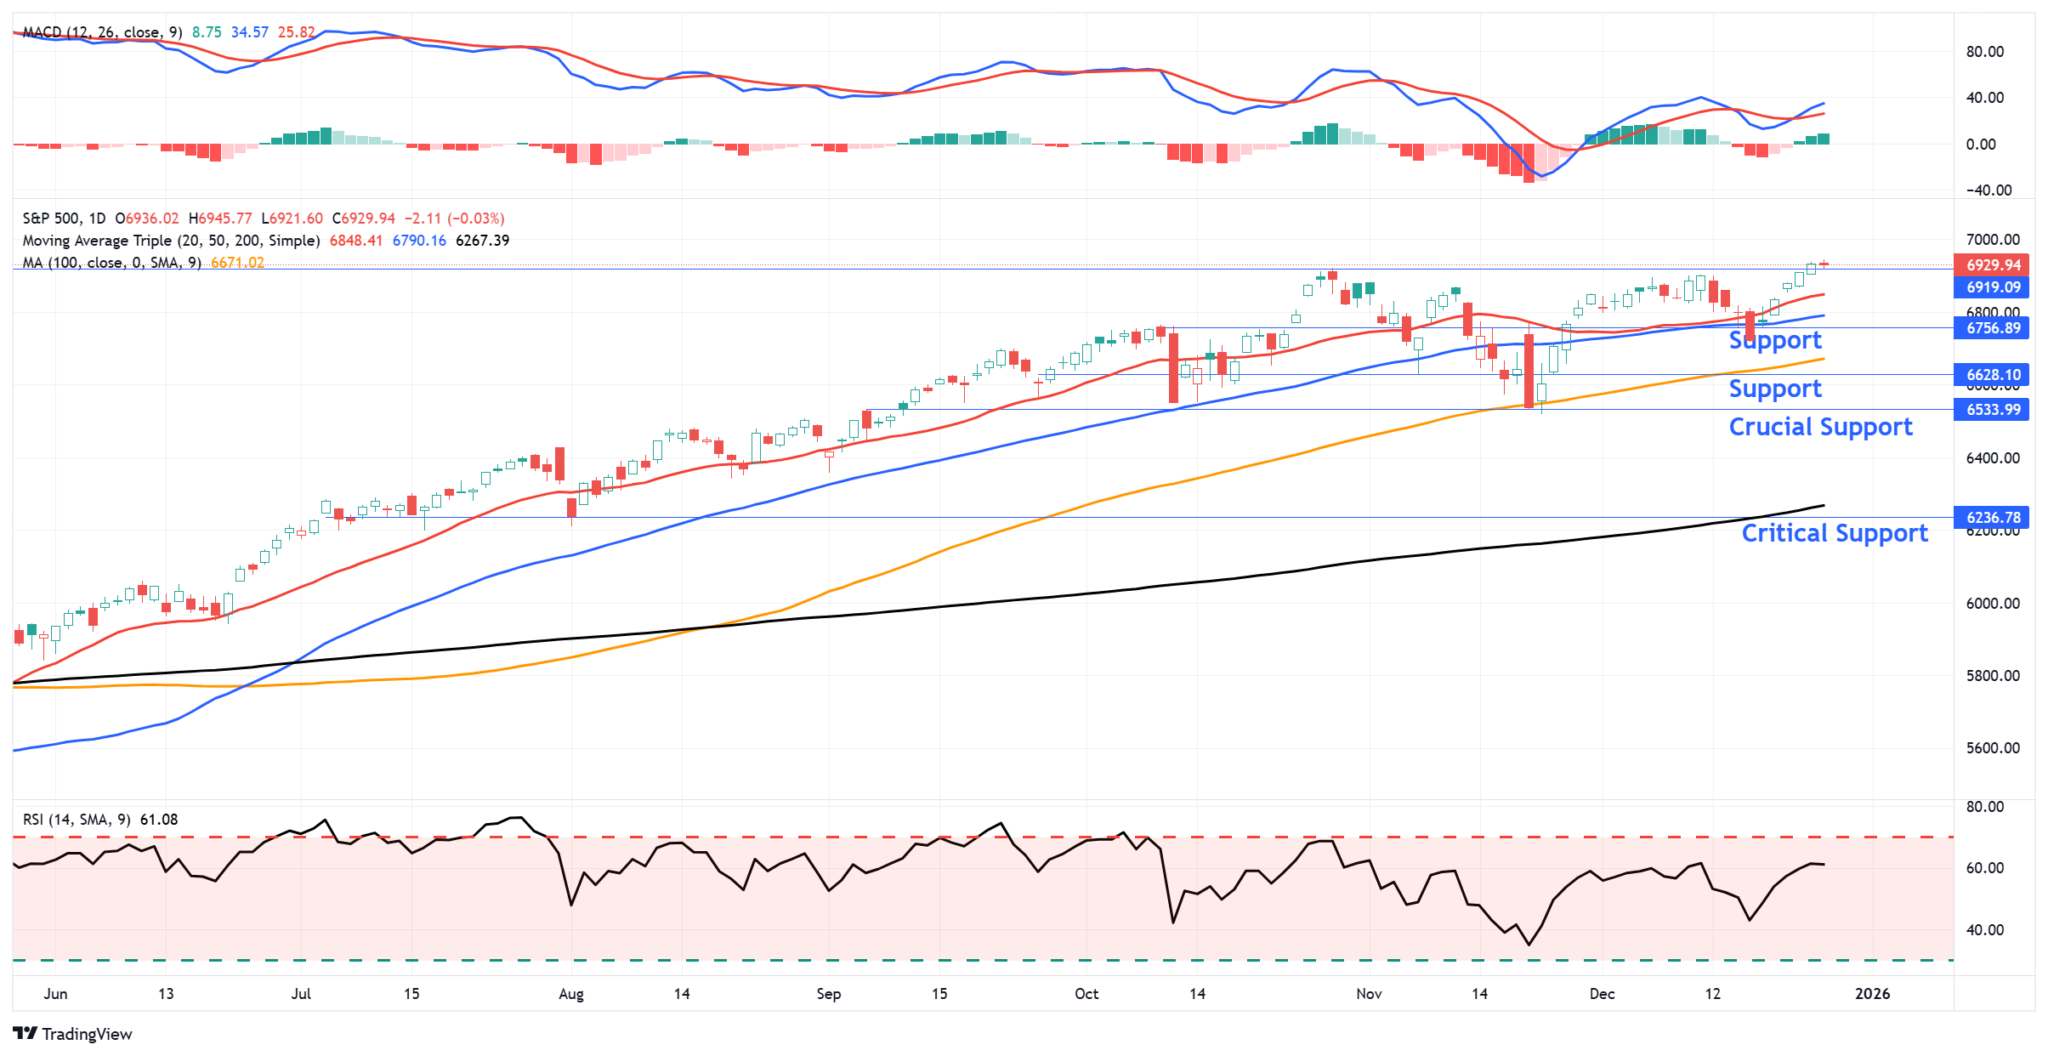
However, heading into next week, such a pullback seems less likely, but not impossible. As such, investors should continue to monitor and manage risk accordingly.
Momentum indicators such as RSI remain elevated but not yet extreme, implying that while the trend is intact, upside extension could fatigue without fresh catalyst. Seasonal patterns and low liquidity during holiday trading often distort technical signals, increasing the probability of false breakouts and whipsaw price action as we move further into the New Year.
From a risk management perspective, consider taking some profits and rebalancing risk toward the end of next week if the market pushes toward 7,000.
Specific Key Levels to Watch Next Week
- S&P 500 Support: 6,848, which is the running 20-day moving average.
- Next Support: 6,790 just below at the 50-day moving average
- Crucial Support: 6,671 is the 100-day moving average.
- Critical Support: 6,267 is the 200-day moving average
- S&P 500 Resistance: 6,940ish, which was Friday's intraday high.
Technical risk remains asymmetrical. A clean breakout above resistance would justify continued positioning. At the same time, failure to hold key support zones would shift focus to deeper retracements early in 2026, mainly if liquidity thins further and sentiment deteriorates.

Volatility Ends The Year With A Whimper
As shown below, courtesy of FinViz, the VIX volatility index spiked in April following the announcement of Liberation Day tariffs. At the time, many pundits, ourselves included, thought the year would be a roller coaster of sorts. Instead, the market steadily advanced, rising almost 45% from the April lows. Similarly, volatility simmered down in the summer months. Heading into year-end, the VIX is likely to settle near the year's lows.
Some view this low VIX level as a sign of complacency. Not surprisingly, after three consecutive years of 20%+ gains, investors are not emphasizing the need to hedge. Between the Supreme Court's ruling on tariffs, numerous geopolitical risks, a new Fed Chair, and mid-term elections, might next year be the roller coaster ride everyone expected this year?

The Week Ahead
With another holiday-shortened week underway, economic data will be limited. Of importance will be the FOMC minutes from the meeting three weeks ago. This will provide a better opportunity to assess whether the Fed will continue cutting rates or is truly considering pausing for a while. Trading activity will be light; however, year-end rebalancing and window dressing could cause some volatility. Much of the year-end-related trading will likely occur earlier in the week.
Tweet of the Day
“Want to achieve better long-term success in managing your portfolio? Here are our 15-trading rules for managing market risks.”
Please subscribe to the daily commentary to receive these updates every morning before the opening bell.
If you found this blog useful, please send it to someone else, share it on social media, or contact us to set up a meeting.
The post The Consumption Conundrum appeared first on RIA.
Full story here Are you the author?You Might Also Like
 Does AI Capex Spending Lead To Positive Outcomes?
2025-12-12
As someone who views corporate finance through a pragmatic lens, I’ve been closely watching the current surge in capital expenditures (capex) tied to artificial intelligence (AI). The question I’m addressing here is this: when a company spends massive amounts of free cash flow and takes on increasing debt, in this case for AI CapEx, does …
 Hawkish Or Less Dovish? QE Or Not QE?
2025-12-11
There is a growing divergence of views among FOMC members. Some remain dovish, favoring more rate cuts. Their argument is based on a belief that inflation will continue to move toward the 2% target and that the weakening labor market benefits from lower interest rates. On the other side of the aisle are hawkish views. …
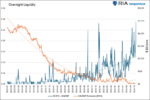 Liquidity Warning: SOFR Raises The Red Flag
2025-10-17
In our Daily Commentary from October 9th, we alerted readers to the fact that the Fed’s Overnight Repurchase Program was warning that the financial system was running out of a reliable store of excess liquidity. While not a concern, as we share in our quote below, it was worth monitoring. Said differently, after years of …
Tags: Featured,newsletter