Recently, we have seen claims that the "collapsing" dollar will cause inflation. While a weaker dollar can create inflation, many factors impact prices. Accordingly, we have two issues with such dire statements. First, the dollar is not collapsing. Second, we have experienced much more significant dollar declines without an inflationary impulse.
The dollar has fallen nearly 10% since the new year. Yes, that is a big move for the dollar. However, context is vital. The graph below shows that the dollar, even after its decline, remains well above its average since the trough in 2008. The green dotted line shows that the dollar is at the lower end of its recent range. But it is still ten percent above the lows of the prior decade (red dotted line).
We circle the period from the dot-com bubble's peak to the financial crisis's worst days. The dollar fell from 120 to nearly 70, much more than the recent sell-off. During that period, CPI averaged 2.9%, compared to 3.1% in the ten years prior. The dollar collapse from 1985 to 1987 was met with lower inflation than the prior period.
A weaker dollar can be inflationary, but much larger forces are at work steering prices!

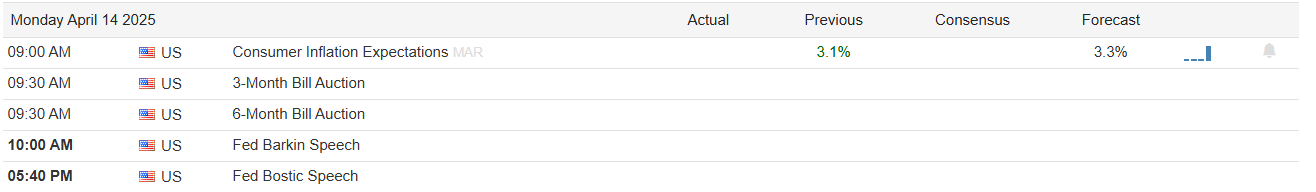
What To Watch Today
Earnings

Economy
Market Trading Update
Last week, we noted that the market was not expecting retaliation from China.
"Rather than coming to the table to negotiate, China responded with a reciprocal 34% tariff on the U.S. plus export controls on rare earth metals needed for technological production. China is playing "hardball" negotiating tactics with Trump. This was a smart move from a negotiating standpoint by China, allowing President Xi to open tariff discussions from a point of strength. However, without some resolution to the extraordinary tariffs, the market will remain in turmoil for quite some time."
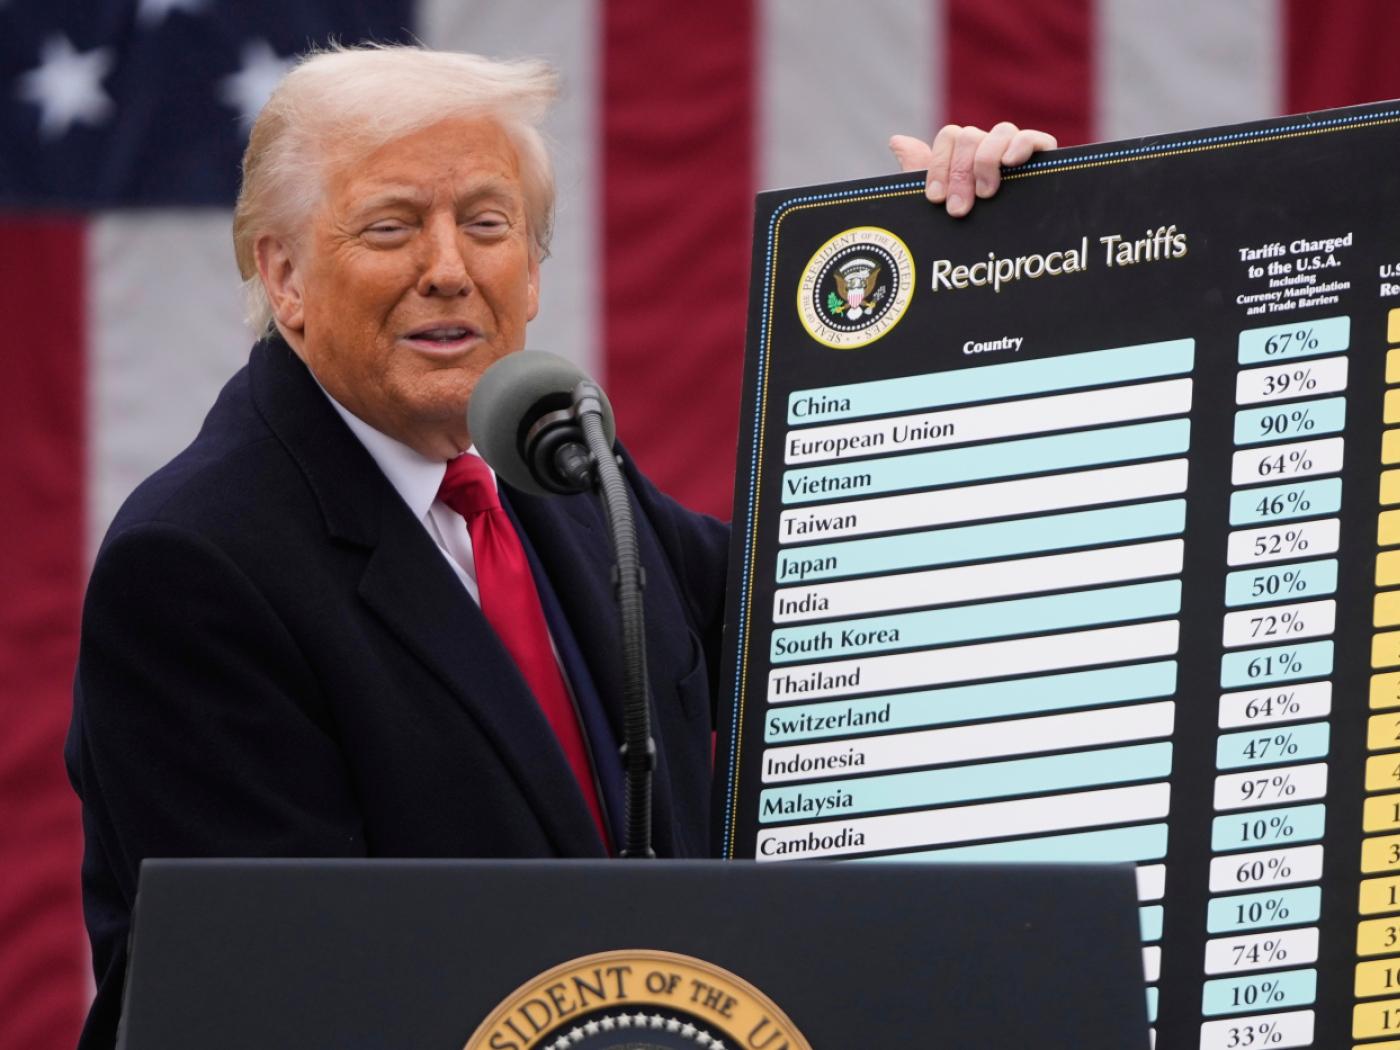
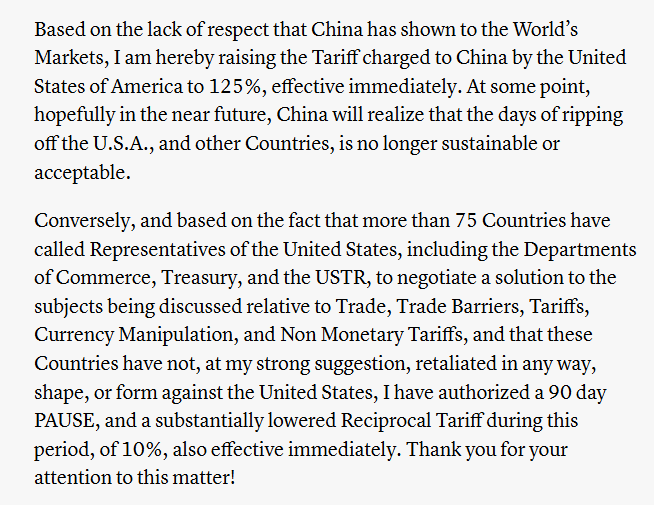
That battle persisted this week as Trump raised tariffs on China to 104%, and China then retaliated with a further tariff increase of 84%. However, as we said last week, any good news would cause the market to rally sharply. On Wednesday, President Trump announced a 90-pause on the full effect of new tariffs. Interestingly, the same headline sent stocks surging on Monday but was quickly deemed "fake news" by the White House. I suspect that Monday was a "leak" by the White House to test the market response, and President Trump kept that announcement handly to stave off a further decline in the markets. Whatever the reason, the markets needed the break. Here is Trump's full statement:
From a technical view, the market completed an expected retracement from the October 2022 lows. Last week, we laid out the potential correction levels.
- The recent lows are around 5500. (That level was violated)
- Immediately below that is the 38.2% retracement level at 5134 (Is being challenged)
- Lastly, the 50% retracement level at 4816 should hold, barring the onset of a fiscal event or recession.
Notably, we stated that:
"The market should be able to find some support at this level and muster a short-term rally next week. However, there is a downside risk to 4816, which would be a 50% retracement of the bull market rally. Any positive announcements over the weekend could spark a relatively robust reversal rally, given the more than three-standard deviation gap between where the market closed and the 50-DMA."
That 38.2% retracement level, using the bull market from October 2022 lows, was broken early Monday morning as stocks plunged lower amid rising tariff concerns and a blowup in the bond market. However, the market finally tested the 50% retracement level on Wednesday morning. Given the deep oversold condition, President Trump's announcement to pause tariffs led to the 3rd largest single-day rally since WWII. For now, the market should be able to hold support at the previous lows and hopefully find a bit more relief into next week.

As I noted in the previous two weeks, we strongly lean toward the potential of the markets beginning a more extensive corrective process, much like in 2022. We will revisit that analysis in this weekend's newsletter. However, while we are concerned about a continued correction process as markets realign prices to forward earnings expectations, there will still be strong intermittent rallies. As noted last week, nothing in the market is guaranteed. Therefore, we continue managing risk accordingly, and as we stated last week and executed on Wednesday, we are now in "sell the rally" mode until the markets find equilibrium. When that will be, we are uncertain, so we continue to watch the technicals, make small moves within portfolios, and reduce volatility risk as needed.

The Week Ahead And PPI
PPI was much weaker than expected. The headline figure was -0.4 % versus expectations of +0.2%. Moreover, the core number was -0.1 %, 0.4% less than expectations. The data within PPI that feeds PCE prices also point to a weaker PCE report later this month.
Retail sales data on Wednesday, Fed speakers, and earnings will be interesting, but tariff discussions and volatile market activity will likely dominate the headlines. Retail sales could be strong if consumers started to stockpile goods in March. Yet, they could also be weak if consumers start to pull back on spending as recession fears increase. Regarding the Fed, we are listening closely for signs that liquidity is becoming problematic. Accordingly, will they offer any prescription ideas to potentially increase liquidity?
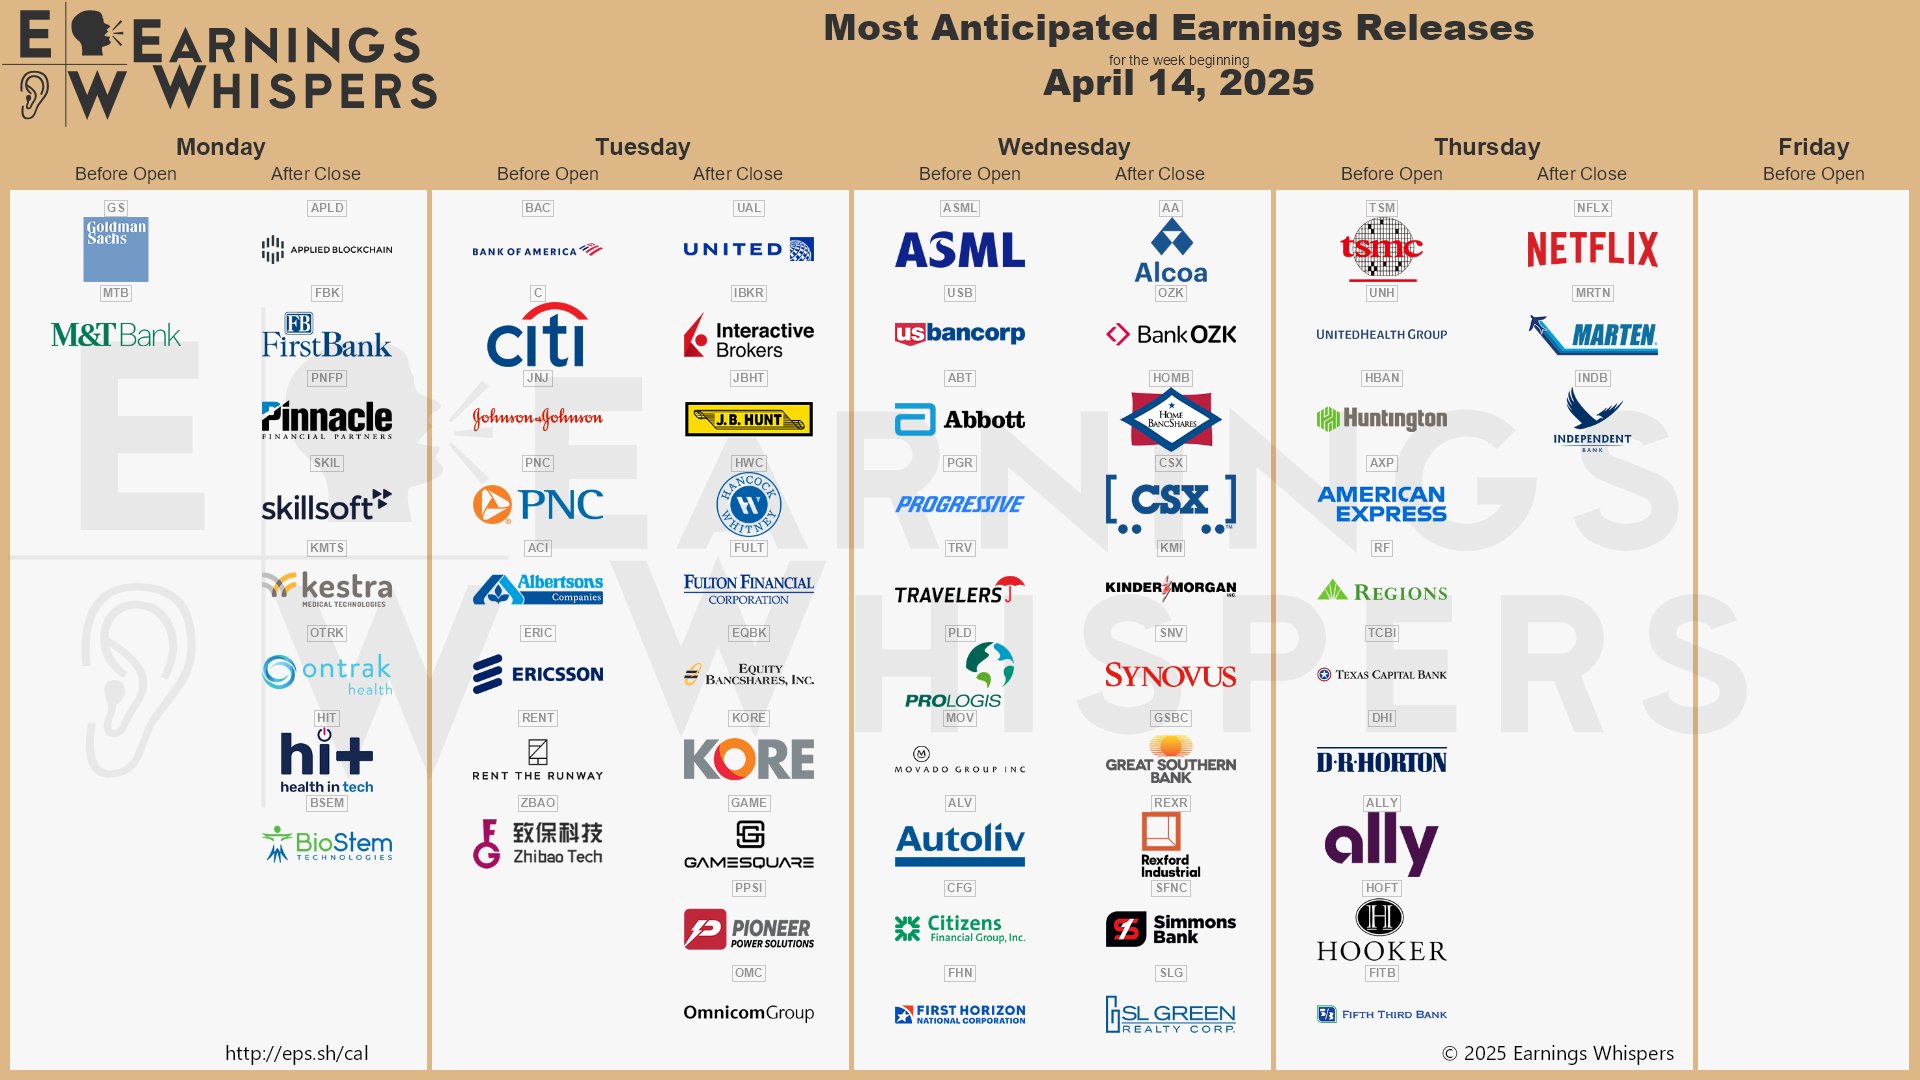
As shown below, courtesy of Earnings Whispers, there are a few big earnings announcements, but the following week will pick up significantly.
The markets will not be open on Friday for the Good Friday holiday.
The Consumer Is Tapping Out
The recent implementation of tariffs has the media buzzing about increased recession odds as the consumer faces potentially higher costs. While recent economic reports, like the latest employment report, still show robust growth, those data points run with a lag that hasn’t yet caught up with reality.
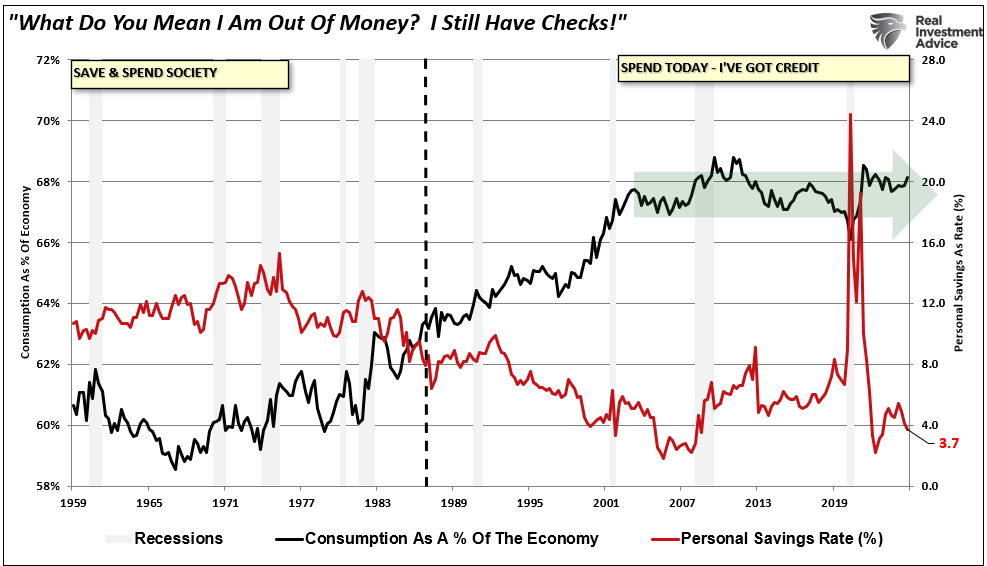
As we have discussed, the American consumer is the backbone of the U.S. economy and comprises nearly 70% of the GDP calculation. While GDP surged following the economic shutdown due to the massive flood of stimulus that fueled a savings surge, consumption as a percent of the economy has remained flat since the turn of the century. The reason is that despite the surge in savings, the consumer was also faced with rising inflation, which left them struggling to make ends meet.
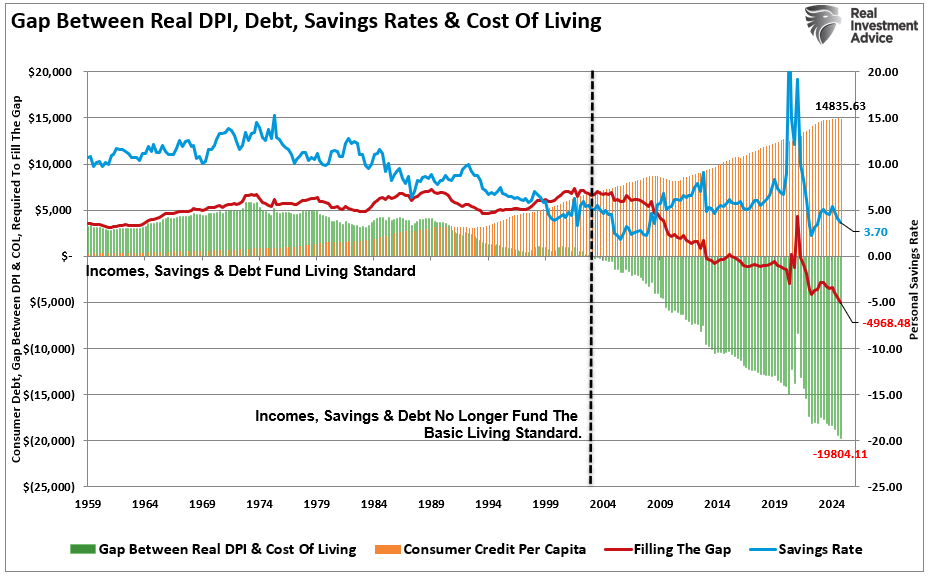
This dilemma is better illustrated by the chart below. The blue line is the personal savings rate, and the red line shows the debt needed annually to bridge the gap between the inflation-adjusted cost of living and savings and incomes. As shown, at the turn of the century, the consumer was no longer able to fund their living standard through just income and savings. The fact that consumers were forced to take on increasing debt levels to maintain their living standards explains why consumption as a percent of GDP has remained stagnant over the same period.
Tweet of the Day

“Want to achieve better long-term success in managing your portfolio? Here are our 15-trading rules for managing market risks.”
Please subscribe to the daily commentary to receive these updates every morning before the opening bell.
If you found this blog useful, please send it to someone else, share it on social media, or contact us to set up a meeting.
The post The Dollar And Inflation: Don’t Believe The Hype appeared first on RIA.
Full story here Are you the author?Tags: Featured,newsletter