The graphs below, courtesy of Truflation, are very telling. The Truflation US Inflation Index uses over 30 million data points to assess price changes and, as a result, provide a robust forecast for the BLS CPI number. Moreover, their data have proven to be an incredibly accurate forecasting tool. As we share in the graph on the left, courtesy of Truflation, their index tends to lead CPI by 45 days. Their comparative analysis shown below stops at the end of 2024. Therefore, we share their current inflation index on the right to help better form expectations for tomorrow's CPI number and, more appropriately, the coming month’s inflation data.
The Truflation Index started the year at 2.77%. It has since plummeted to 2.11%. Thus, if the index remains a good inflation forecaster, CPI price growth could fall significantly by April and May. Regarding tomorrow's CPI report, the Truflation gauge's recent decline will likely not show up in the January data the BLS will report due to the 45-day lag.

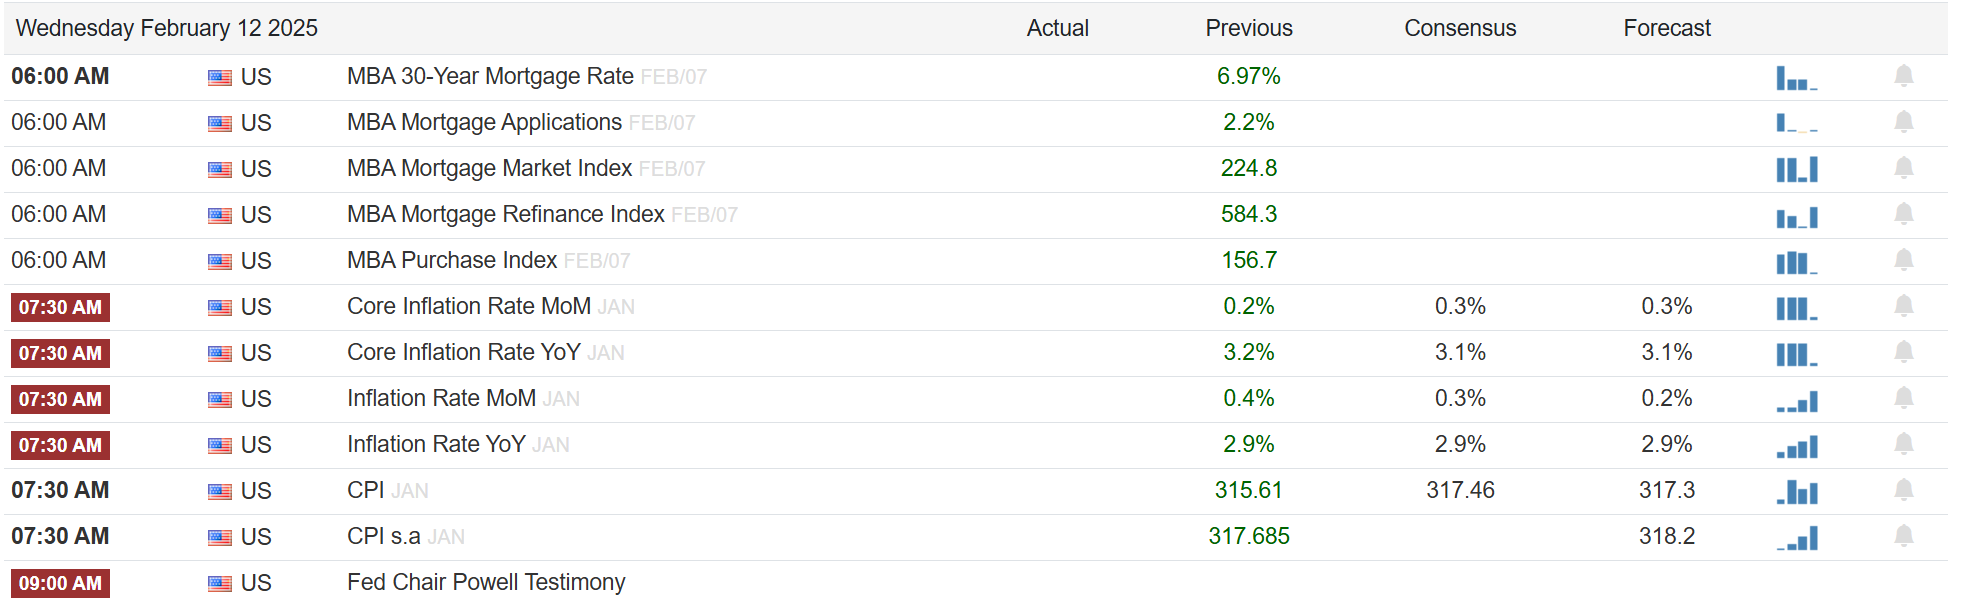
What To Watch Today
Earnings

Economy
Market Trading Update
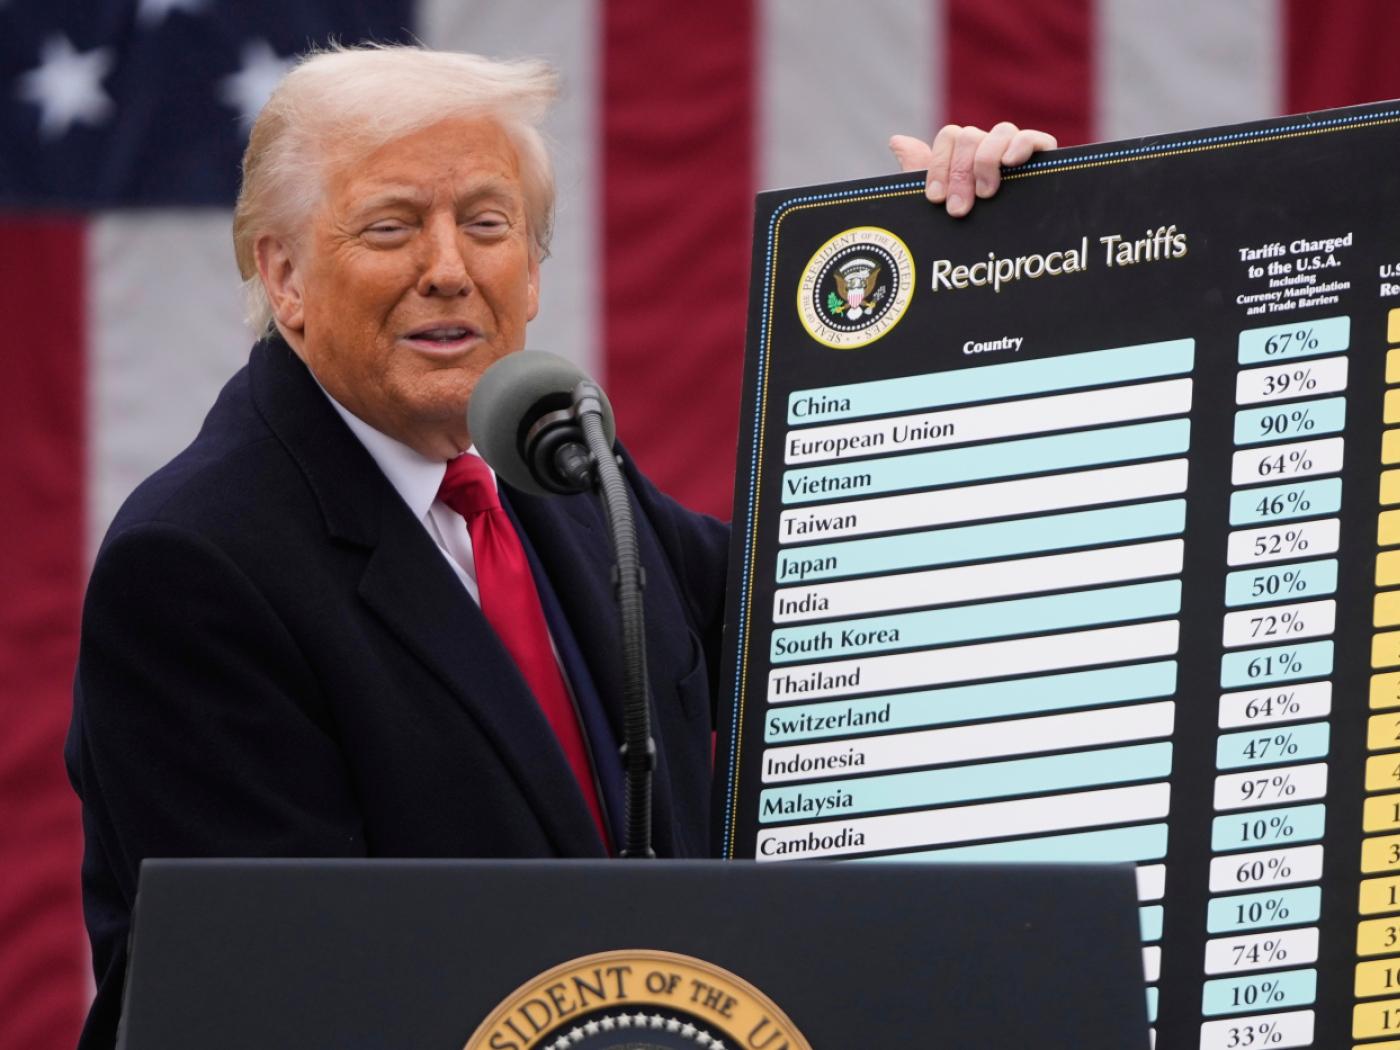
Yesterday, we discussed the more rampant enthusiasm of retail investors which continues to support markets even when there is troubling economic news or data. Yesterday, the markets started out weaker on news that President Trump was initiating 25% tariffs on steel and aluminum products. However, as has been the case lately, investors stepped in to start buying stocks and pushed the index positive by the close.
Notably, that consistent buying pressure has kept the MACD "sell signal" from being triggered while money flows remain strongly positive. The sloppy trading is keeping the market from getting short-term overbought, however, the compression in the current trading range is setting the market up for a breakout. Today, all eyes will be focused on the CPI data. A cooler-than-expected report will send the market back to all-time highs. A hotter-than-expected report will trigger a sell signal and a break of support at the 50-DMA.
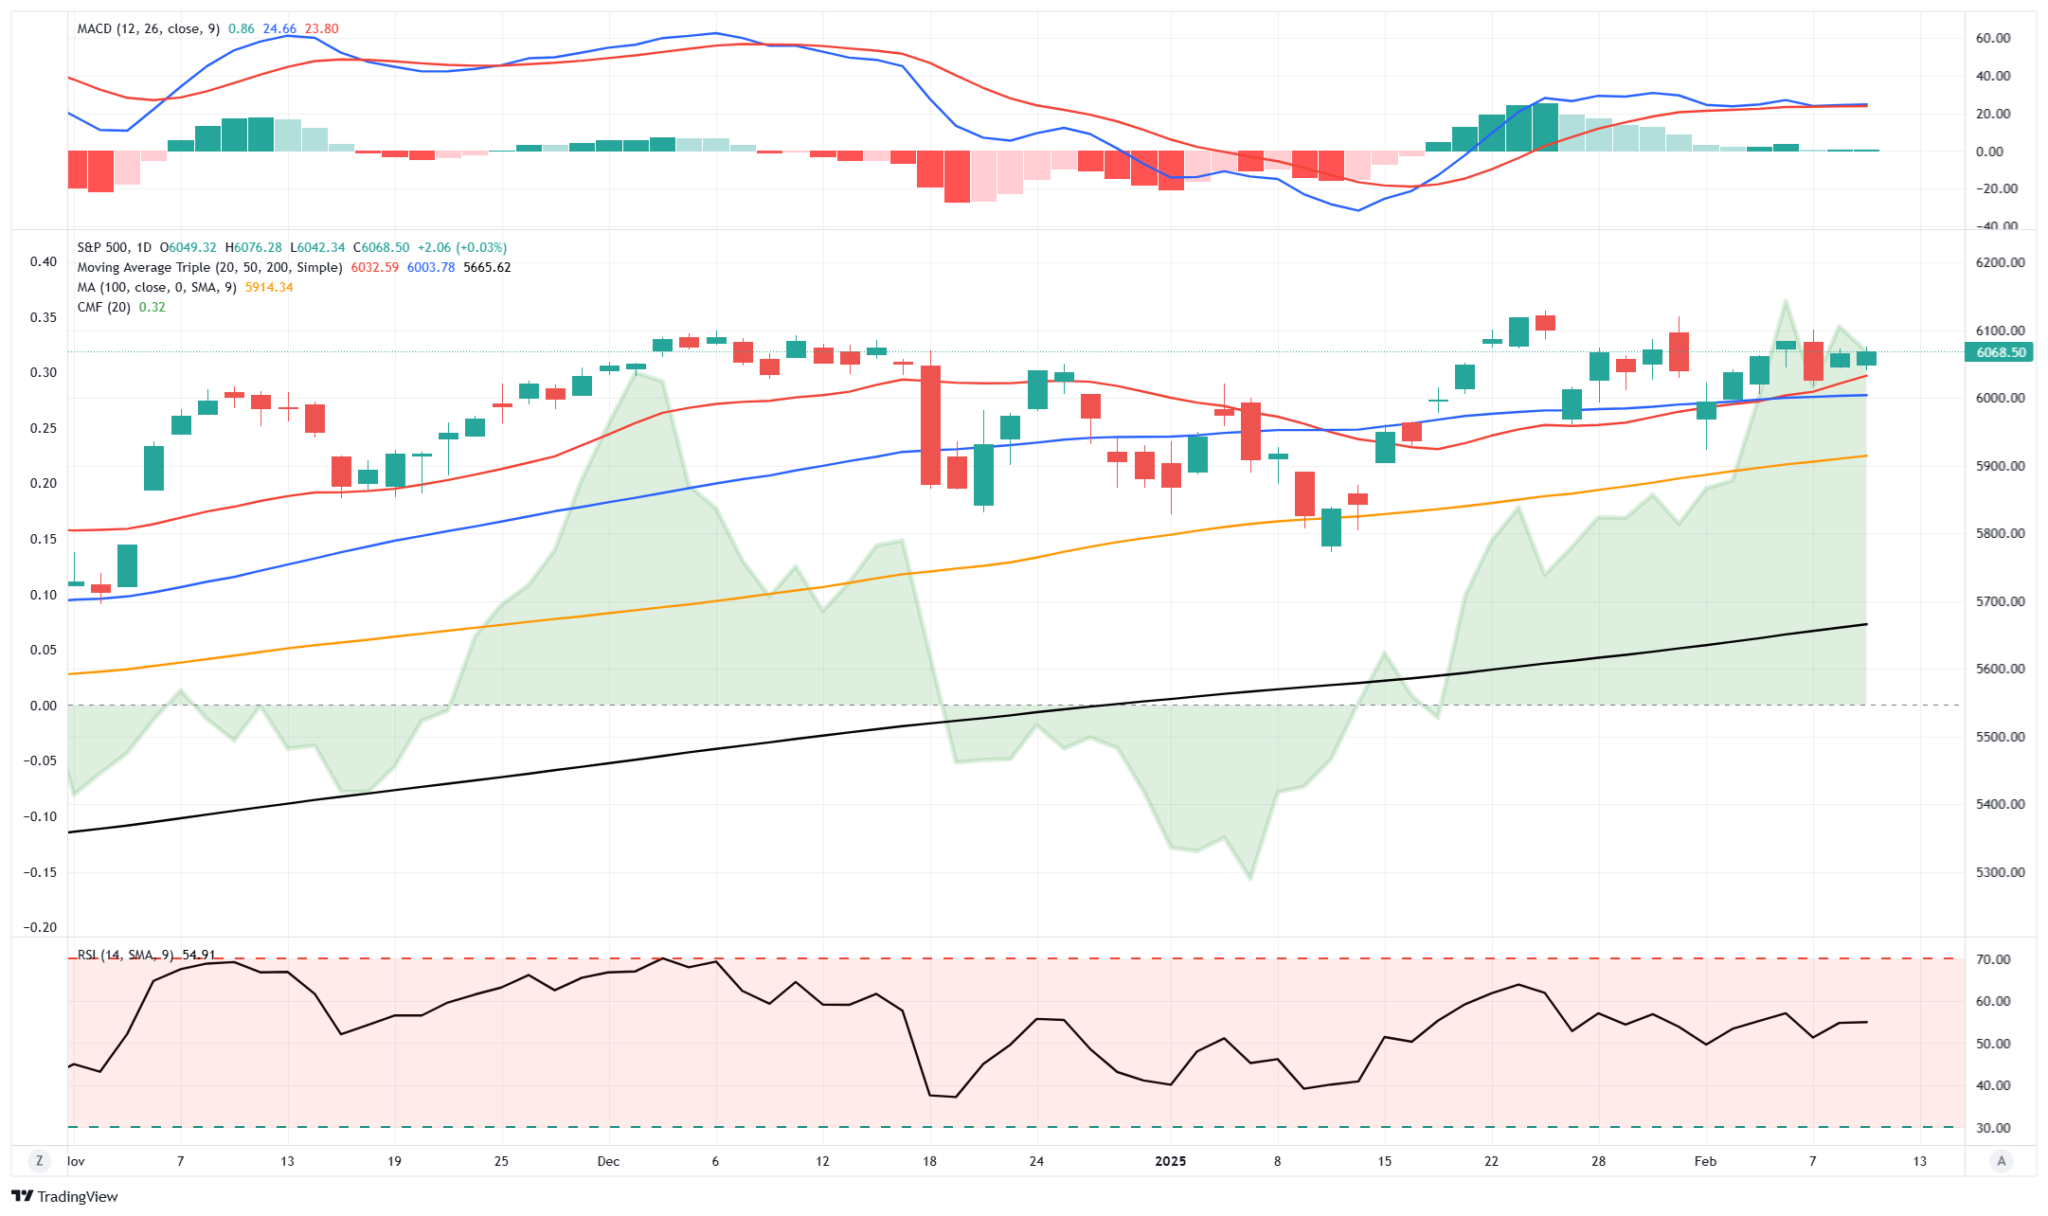
While longer-term data, as noted above, continues to suggest that inflation will cool, monthly reports are volatile and a wildly subject to short-term price movements and analysis. As such, while the market will likely react sharply to today's report, I would not read too much into it and start making drastic changes to your portfolio.

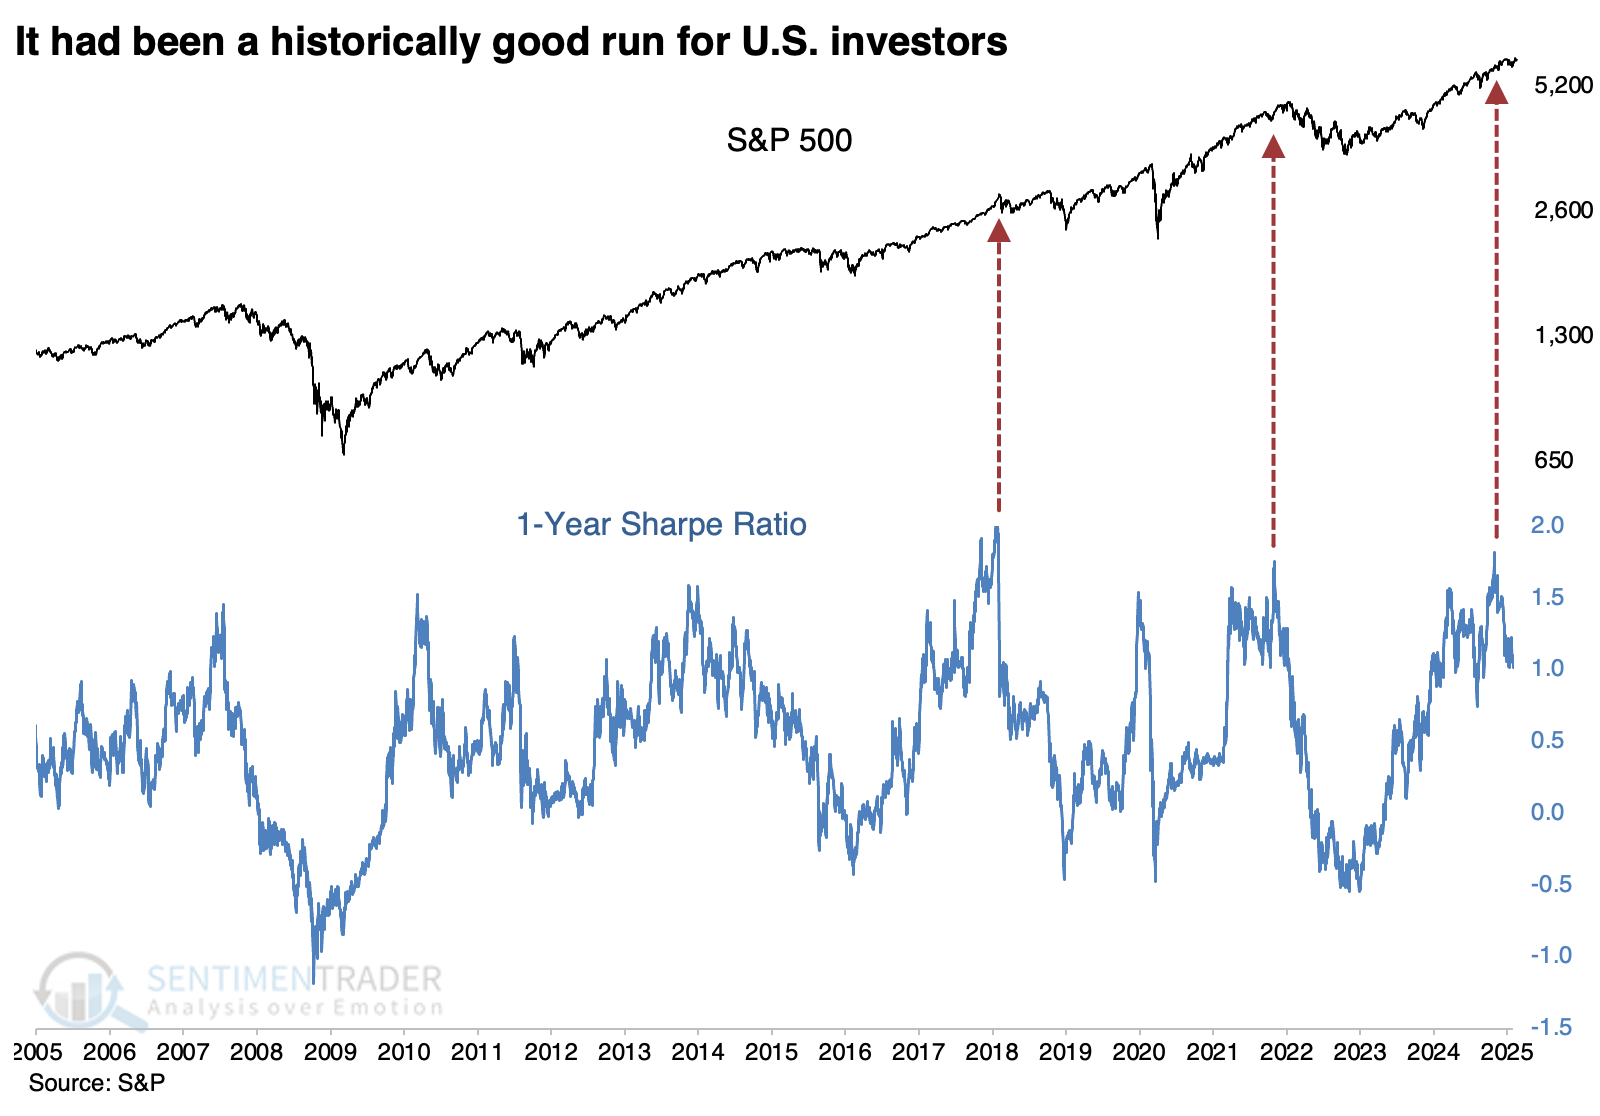
The Market's Sharpe Ratio Offers Caution
The Sharpe Ratio measures excess return per the amount of risk, i.e., volatility. Accordingly, it provides investors a good tool to compare asset or security returns. The higher the ratio, the better the investment on a risk-adjusted basis. The graph below calculates the Sharpe Ratio for the S&P 500. Consequently, as it shows, it peaked recently at 1.75. Such is historically a very high ratio. Unfortunately, often, after periods of strong returns and low levels of volatility (risk), the ratio normalizes. Thus, returns are usually poor, and volatility increases. The graph from Sentimentrader highlights the prior two times such a high ratio occurred.
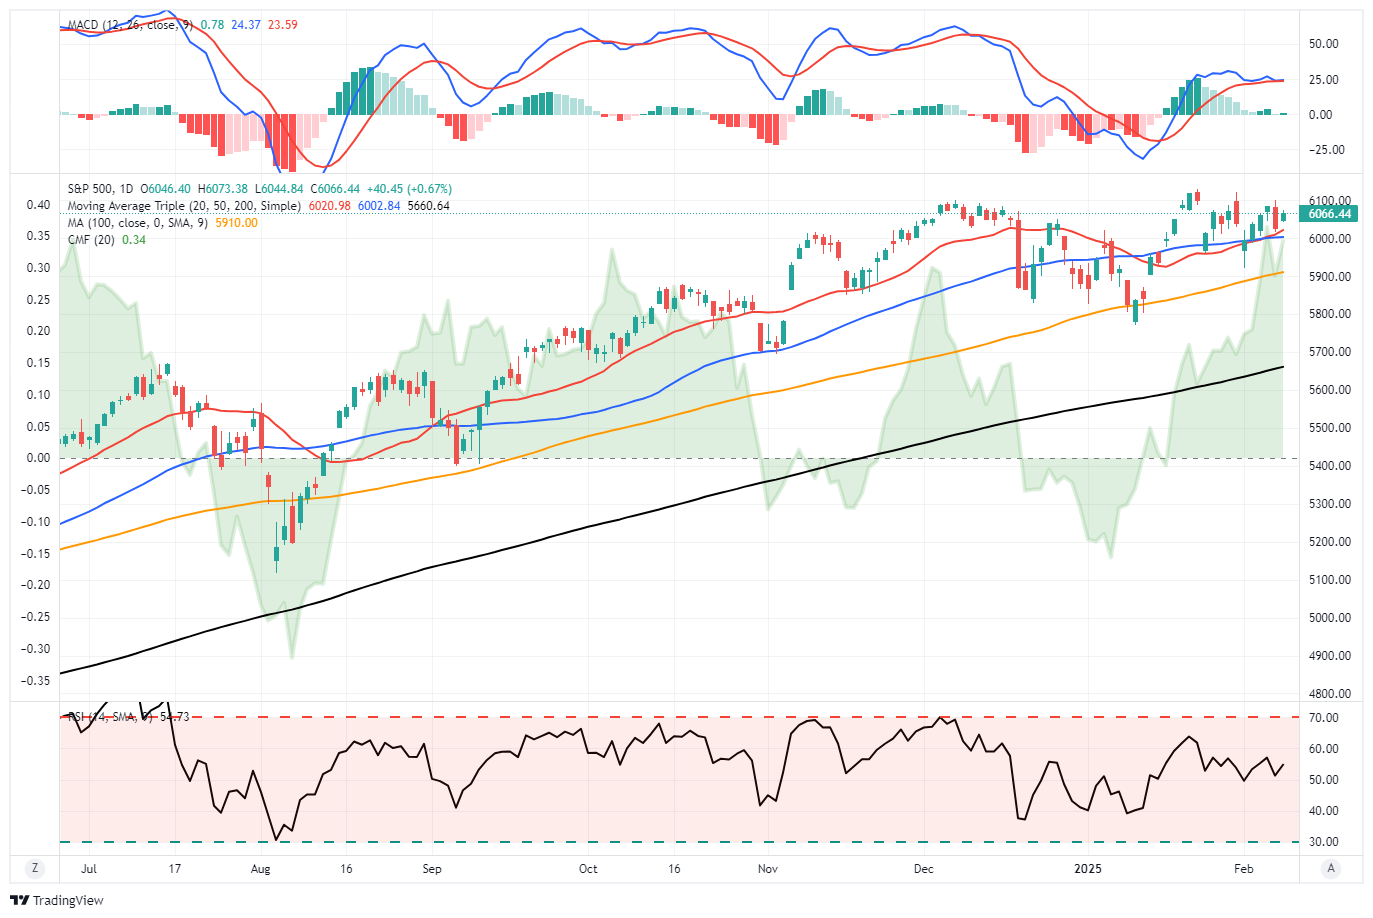
Bull Bear Report - Technical Update
It was a second volatile week of trading, which was unsurprising given the news flow. However, despite the volatility, the market continues to hold support within the current bullish trend. The market is not overbought, and the money flow remains strongly positive.
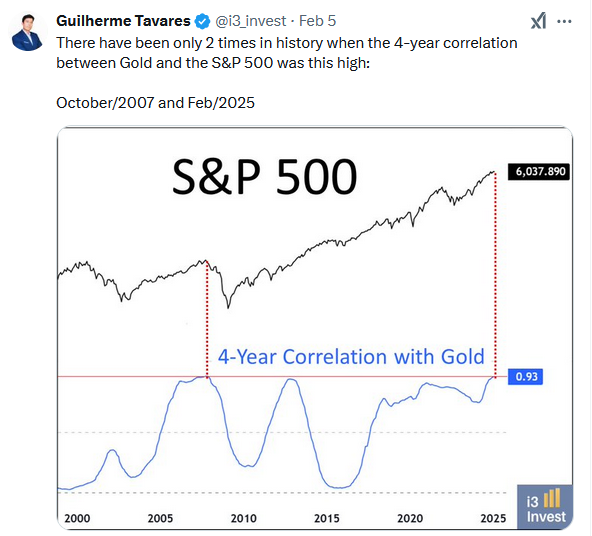
Tweet of the Day
“Want to achieve better long-term success in managing your portfolio? Here are our 15-trading rules for managing market risks.”
Please subscribe to the daily commentary to receive these updates every morning before the opening bell.
If you found this blog useful, please send it to someone else, share it on social media, or contact us to set up a meeting.
The post Truflation Data Points To A Coming Decline In CPI appeared first on RIA.
Full story here Are you the author?Tags: Featured,newsletter