The percentage of S&P 500 stocks outperforming the index on a rolling 21-day period fell below 15% late last year. That aligns with the record low set last July. Needless to say, the market's breadth is historically horrendous. Last July, after months of significant outperformance by the mega-cap stocks, the poor market breadth corrected quickly. Given similar circumstances, let's review what happened last July. The following comes from our July 19, 2024 Commentary- Stock Rotations On Steriods.
On Wednesday, the Nasdaq fell by nearly 3%, the most significant decline in over two years. However, the Dow, representing more value stocks, was up over half a percent and set a record high. If the recent rotations out of technology, communications, and the largest market-cap stocks continue, the broad S&P 500 and the Nasdaq will likely decline. However, might the small cap, medium cap, and value stocks that have been lagging considerably do well?
To help us better appreciate the current bout of bad breadth, we share the SimpleVisor analysis below comparing the price ratio of the equal-weighted S&P 500 (RSP) to the market cap-weighted S&P 500 (SPY). The highlighted box shows the July instance. Furthermore, three technical indicators (circled in yellow) show that the RSP to SPY price ratio was very oversold and flipped to a buy signal. While the bad breadth hasn't so far lasted as long or been as severe as July, the buy signals could be telling a rotation to those stocks out of favor in December may be upon us.

What To Watch Today
Earnings
- No earnings releases today
Economy

Market Trading Update
The first trading of 2025 didn't go as well as hoped, as "Santa Claus failed to visit Broad and Wall." As noted yesterday, following two years of 20%- plus gains, some profit-taking was not surprising; however, the failure of the markets to rally into year-end has some historical precedents for the next year. Yes, the market has been weak as of late, which was suspected given the ongoing MACD "sell signal," weak relative strength, and declining market breadth. However, there are no signs that this is more than a normal correctional process after a very strong year of returns.
From a technical standpoint, the market is getting very oversold in the short term, and sentiment is becoming more negative. As of last Friday, the markets were moving into more "neutral" territory, and after this week's action, we are likely there.

With the market pushing lower levels and approaching the 100-DMA, we should expect a bounce as early as next week when traders come back from their Christmas break vacations. A bounce back toward 6000 would be the most likely target and should be used to rebalance risk and raise cash as needed. With a weak start to the New Year, the action next week will set the tone for the rest of the month.

My big concern for 2025 remains earnings estimates, which are extremely elevated. As I will discuss further at the upcoming Economic Summit on January 18th, current estimates are for $249/share in 2025. As of Q4, earnings are at $208, and the long-term trend is $181. This puts current valuations at risk this year if the economy slows much at all.

Trade accordingly.

Tesla Annual EV Sales Decline
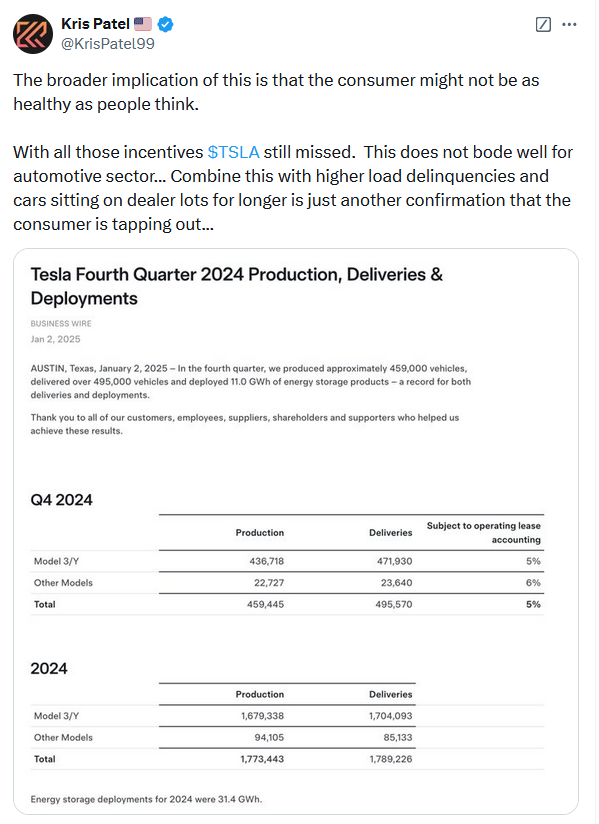
Tesla's annual EV sales have declined for the first time in a decade. Part of the decline was due to sales in the fourth quarter. Tesla reported delivering 495k cars in Q4, well below estimates of 512k. The graph below shows that revenues have plateaued, at least for now. Despite much slower growth, its share price was up over 60% last year. Tesla shareholders seem to be ignoring its recent business trends. Instead, they are likely focusing on the potential of its automated driving and robot projects. Its valuations are extremely high due to weak growth but significant perceived growth potential. Its forward P/E is 120, trailing P/E 107, and price-to-book ratio is 17.
Below the revenues chart is Tesla's fair value based on the average of three traditional models. As shown, Tesla shares are more than double its fair value. Bear in mind that the models do not consider future growth.
The second graphic shows Telsa shares doubled in price following the election but have since started to give up some of those gains. While Elon Musk's relationship with Donald Trump will undoubtedly benefit shareholders, Tesla must still deliver sales and earnings.


Tweet of the Day

“Want to achieve better long-term success in managing your portfolio? Here are our 15-trading rules for managing market risks.”
Please subscribe to the daily commentary to receive these updates every morning before the opening bell.
If you found this blog useful, please send it to someone else, share it on social media, or contact us to set up a meeting.
The post Is A Breadth Rotation In Order? appeared first on RIA.
Full story here Are you the author? Previous post See more for Next postTags: Featured,newsletter


