|
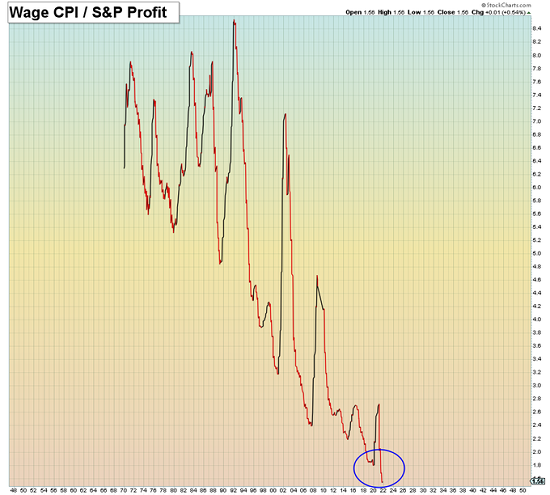
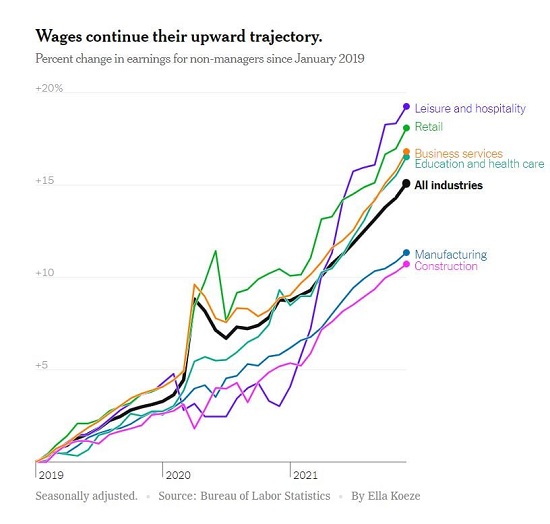
Most people would be horrified by a 40% decline in their “investments.” When bubbles pop, speculative assets don’t drop 40%, they drop 90% or even 98%. The irony of the sudden panic about real-world inflation generated by rising wages is two-fold: 1. The status quo never mentions the rampant inflation in assets, because the already-wealthy got wealthier, so asset inflation is wonderful and deserves to be permanent Look at the chart below (courtesy of Mac10) of the S&P 500 / wages adjusted for the CPI (consumer price index): corporate profits have soared against wages since 2009. 2. Wages have been hammered since 1975, as RAND Corporation research found $50 trillion has been transferred from the workforce to capital in the past 45 years. (see chart below) The wealthy had no complaint about wages losing purchasing power for 45 years, but the first little blip up in wages’ purchasing power causes a panic. Now that the trends of soaring asset inflation and deflation of labor have reversed, assets will deflate and wages will rise, sending the wealthy and their apologists, toadies and media tools into panic. “Markets rise on a escalator and fall in an elevator” is a Wall Street saying, but there is more than reversion to the mean or other technical dynamics at work: the obscene wealth that’s been transferred to the top 0.1% is now a political target. Being self-supporting at 19 years of age sharpens one’s memory of earnings, costs and the purchasing power of a day’s labor. I kept a logbook of all expenses, no matter how modest, in my early 20s when my wages were low due to limited hours (being a full-time university student) and low pay. |
|
| By the absurdly understated official inflation calculator(https://www.bls.gov/data/inflation_calculator.htm), the $1.65/hour we earned as minimum wage in 1970 is now worth $12.17.
But when I recall what I could buy with my modest wages, I think the more realistic equivalent is $16 to $18/hour. The $3.50/hour I made in 1974 is officially worth $20, but in terms of what I could buy with that $3.50, it’s more like $30/hour. For example: in 1974, the rent for my low-end studio in Honolulu was $125/month. (Recall that Honolulu has long been one of the most expensive cost-of-living cities in the U.S.) It took 35 hours of labor to pay the rent (ignoring taxes for simplicity). Today, it takes about 60 hours of labor at $20/hour to pay the rent on a studio in Honolulu ($1200/month). Much is made about the higher quality of goods today and the lower cost of electronics, etc. But we forget that TVs, appliances, etc. lasted a long time back then, so such purchases were rare. Used goods were available for a fraction of new. The worker making $3.50/hour in 1974 could buy more and save more than the worker making $20/hour today. As an experienced (but not yet full journeyman) non-union carpenter in 1977 (age 23), I was earning $7.50/hour. According to official inflation, that’s worth almost $36/hour today.
|
|
| How many experienced 23-year old carpenters make $36/hour today? My guess is relatively few, though short-term piecework and boomtown jobs may offer high wages for brief periods. By my calculations of what I could buy then for $7.50/hour, the equivalent today is more like $45/hour. Back then, I paid rent, ownership of a vehicle, taxes, dining out, etc. and still saved 50% pf my net pay.
Is that possible for someone earning $36/hour paying open-market prices for rent, healthcare, vehicle ownership, dining out, etc. to save half their net earnings? Not without a “special deal” on rent or extraordinary sacrifices. I didn’t sacrifice much of anything in 1977, I simply didn’t squander my earnings. There’s a big difference between sacrifices and merely being frugal / careful to get full value. When I was a builder in the mid-1980s, we paid 100% of our employees’ full-coverage healthcare insurance. It was about $50/month for each individual and around $150/month for a family. According to official inflation, $50 in 1985 is now worth $132. Can you buy full-coverage healthcare insurance for an individual for $132 a month now? No. “According to research published by the Kaiser Family Foundation in 2019, the average cost of employer-sponsored health insurance for annual premiums was $7,188 for single coverage and $20,576 for family coverage.” That’s $600/month for a single individual. |
|
| As a result of cartels, monopolies and asset inflation, real-world costs have eaten wage-earners alive for decades.
Asset inflation will reverse into asset deflation for many reasons, and wage deflation will reverse into inflation (i.e. gaining purchasing power) for many reasons. When cycles turn, we seek specific explanations, but the reality is often more systemic: extremes reached limits, diminishing returns turned into negative returns, the pendulum consumed all the available momentum and is now swinging back to the opposite extreme. Look at the chart of wages share of GDP (gross domestic product) below. If wages gained 8% and returned to levels of the mid-1970s, that would be 8% of $21.5 trillion GDP (2021) or $1.7 trillion. That equals $13,000 a year for each of the 130 million workers in the U.S. Corporate profits have risen from $400 billion to $2.4 trillion. What would it take for those profits to decline back to $700 billion? |
|
| Most people gambling in assets don’t think they’re gambling; they think “investing” isn’t gambling. But asset bubbles are not the result of investing, they’re the result of speculation running to extremes.
Most people would be horrified by a 40% decline in their “investments.” When bubbles pop, speculative assets don’t drop 40%, they drop 90% or even 98%. Many tech companies that were $100+ in early 2000 were $4 or even $2 by 2003. This is not at all unusual. We’ve simply forgotten what happens when bubbles pop. The U.S. stock market was worth $53 trillion at the beginning of 2022. If corporate profits fall to $1 trillion annually, and the price/earnings ratio drops to a historically reasonable 11, U.S. stocks will be worth $11 trillion, a decline of roughly $40 trillion or 80%. Recall that U.S. stocks fell to $11 trillion in value in 2002 and again in 2008. “Impossible!” Yes, of course. That’s what everyone thought in 2000 and 2008 just before the bubbles popped. This is the third bubble, and it is the most gargantuan, the most stretched, and so the reversal will be the most extreme. Think elevator, not escalator. Generational inequality, class inequality, wage deflation and the worship of the false gods of “wealth without work” the have all reached extremes. This time is different, but not in the way the status quo expects. |
Full story here Are you the author? Previous post See more for Next post
Tags: Featured,newsletter


