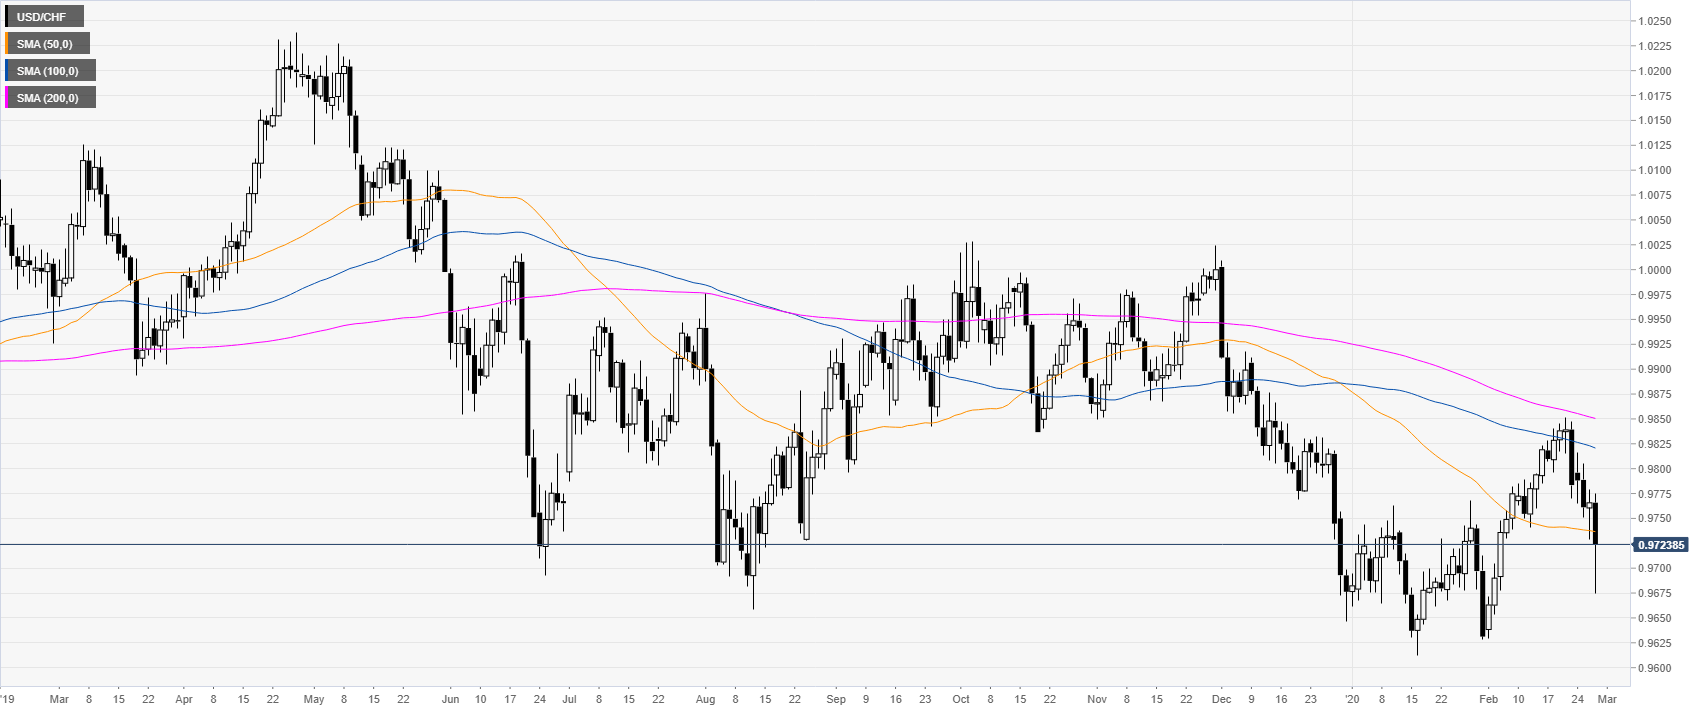
USD/CHF daily chartUSD/CHF is trading below the main daily simple moving averages suggesting an overall bearish bias in the long term. The spot is just below the 50 SMA. |
USD/CHF daily chart(see more posts on USD/CHF, ) |
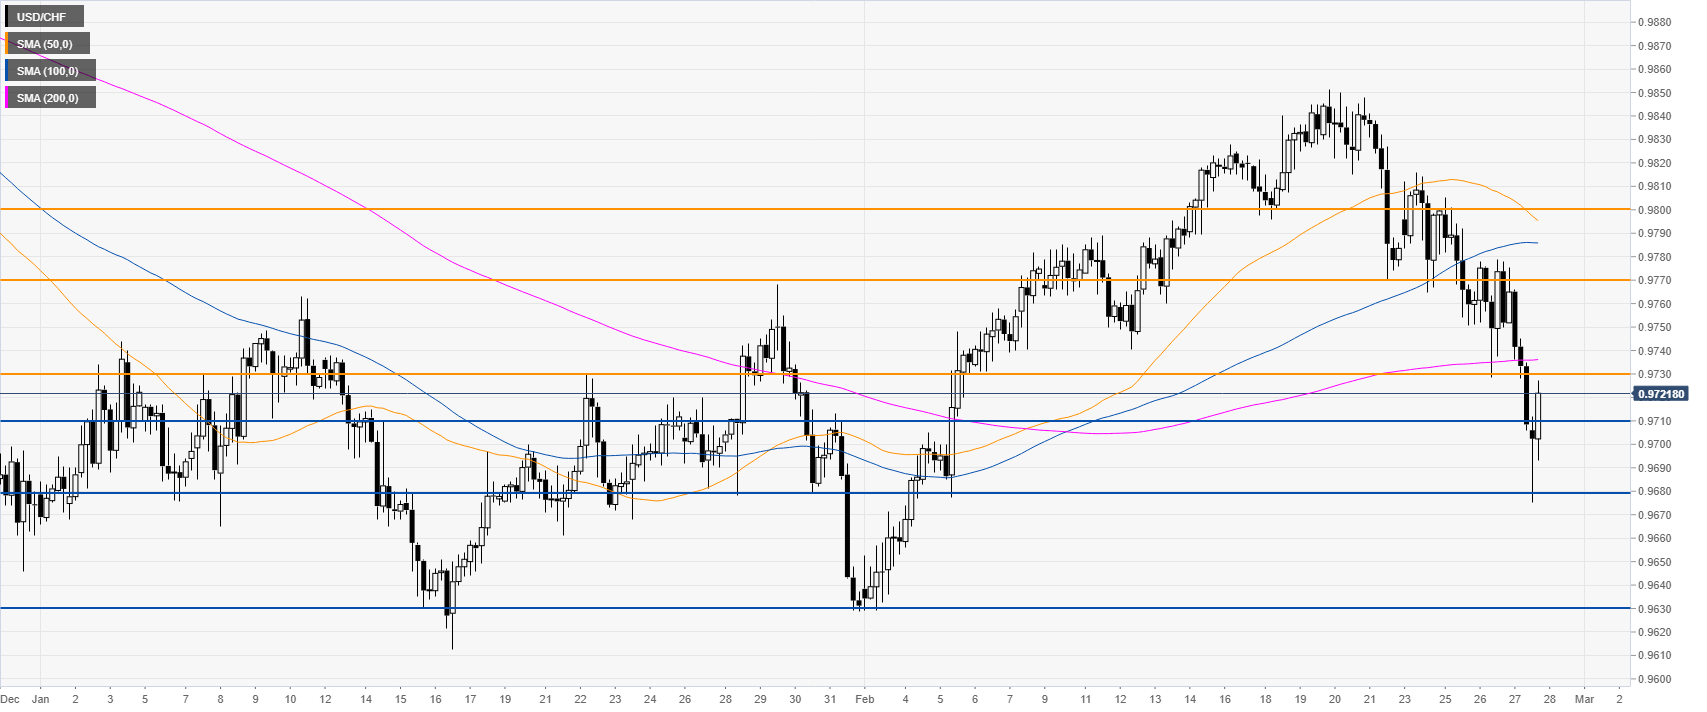
USD/CHF four-hour chartAs expected the spot reached the 0.9680 level from which it is now having a rebound. Bears remain in control as USD/CHF trades below the main SMAs. A break below the 0.9680 support can lead to further losses towards the 0.9630 level. Resistance is seen near 0.9730 and 0.9770 levels. Resistance: 0.9730, 0.9770, 0.9800 Support: 0.9710, 0.9680, 0.9630 |
USD/CHF four-hour chart(see more posts on USD/CHF, ) |
Full story here Are you the author? Previous post See more for Next post
Tags: newsletter,USD/CHF


