If the “equation” CNY DOWN = BAD is valid, and it is, then what drives CNY downward in the first place? In conventional Economics, authorities command the currency to affect the level of exports. In reality, that’s not at all how it works.
The eurodollar system of shadow money is almost purely calculated risk versus return. Before August 2007, everywhere there was believed (far) more return than risk. It’s the nature of bubbles. In the immediate aftermath of 2008, or Euro$ #1, perceptions were changed first by Bear Stearns before Lehman reinforced the shifting paradigm. Dealers for the first time began to appreciate monetary risks, leaving expected returns in the developed world nowhere near enough (what was called the “new normal”).
Opportunity in emerging markets especially China, though, was widely perceived as undamaged. Though liquidity risks were now being respected as a systemic issue, in Asia the plus side reward seemed sufficient to shift the center of balance toward an Asian eurodollar. Until Euro$ #2.
| The second interruption in 2011, as noted before, was the fatal blow to the global system. If uneven, partial global recovery was thought possible in 2009 and 2010, after 2011 there was no safe haven and no easy measure of opportunity any longer. The risk/return balance would have to shift in EM’s, too.
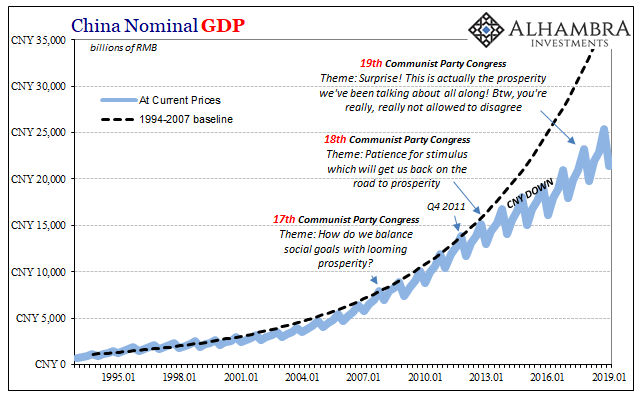
By the start of 2014, even China’s seemingly invincible economy was showing signs of that very decay. Nominal GDP slowed dramatically in 2012 and despite official reassurances at the 18th Communist Party Congress held later in that same year, the following year 2013 did nothing to support them. As time passed following Euro$ #2, confirmation of now more uniformly unfavorable worldwide risk/return.
|
China Nominal GDP, 1995-2019(see more posts on China Gross Domestic Product, ) |
| The Chinese it was thought they at least could be counted on to do anything and everything to achieve growth. After 2011, though, that commitment no longer seemed so assured. Furthermore, it became more of an open question as to whether authorities could hit their own numbers. Less “guaranteed” opportunity in a globally uncertain monetary environment was a recipe for China and EM’s to get smacked hard by Euro$ #3 (as well as contributing to its start).
In 2018, of course, the same CNY equation resurfaced. While everyone talks about trade tensions, China’s economy has been slowing since early on in 2017. It never got restarted during Reflation #3, not really. The deceleration accelerated last year, creating the same sorts of doubts and rebalancing risk/return unfavorably all over again. |
China Nominal GDP, 1995-2019(see more posts on China Gross Domestic Product, ) |
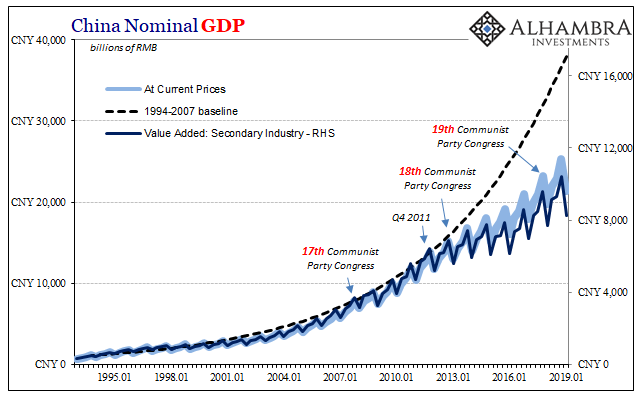
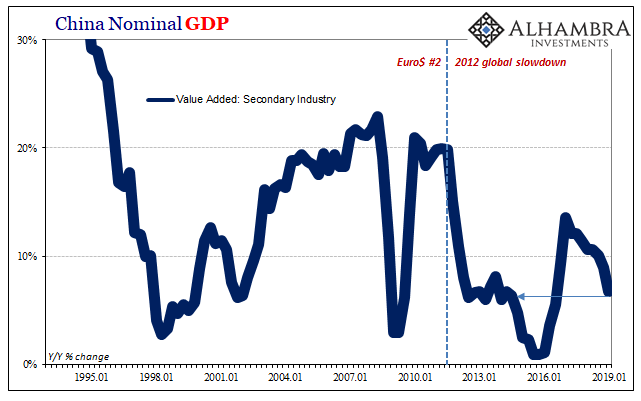
| Because of the focus on trade, most people often miss the nature of what’s going on in China. Industry and manufacturing (China’s National Bureau of Statistics classifies mining, manufacturing, and construction, also utilities, as “secondary industry”; the services economy is placed into the category of “tertiary industry”; agriculture and the like is “primary industry” and today is a very small part of GDP) remain a crucial piece of the Chinese economy. The specific ups and downs are related to the manufacturing sector’s responses to global trade conditions (dominated by these Euro$ problems).
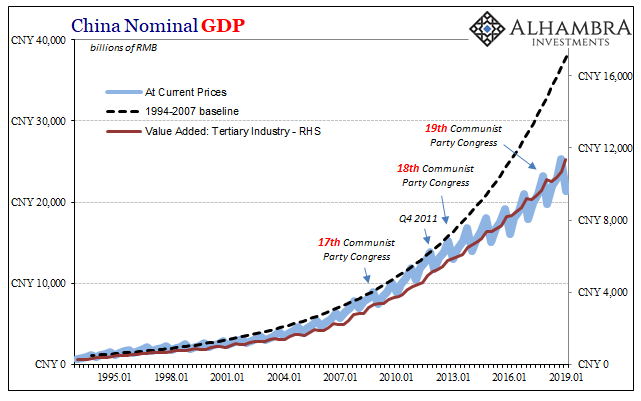
Over the last several years, this has meant Tertiary Industry has surpassed Secondary Industry in its overall contribution to China’s total economy. Many claim this is the rebalancing that authorities have sought in order to deal with the lack of recovery in the global economy. If the US and Europe aren’t going to be able to buy up all of what China has the capacity to manufacture, then the Chinese will have to start buying these things on their own. |
China Nominal GDP, 1995-2019(see more posts on China Gross Domestic Product, ) |
| And it makes for a nice story in line with the mainstream idea about central planning. Whatever happens on the other side of the Pacific, it is immediately attributed to the unfettered abilities of technocrats to achieve their goals. A form of Western self-loathing and envy, many would love nothing better than to see “our” central banks be freed up to act like the PBOC and governments to unleash fiscal spending without politics. |
China Nominal GDP 1995-2019(see more posts on China Gross Domestic Product, ) |
| If you view the rise of the services sector as “rebalancing” then it might seem as of China’s central bank and economic authorities are making the best of a hard situation. But that substantially mischaracterizes the circumstances. Industry, meaning Secondary Industry, is clearly more prone to the ups and downs subjected by the eurodollar system onto the global economy. That’s the nature of a squeeze on global money; trade gets hit first and foremost, meaning the manufacture and production of goods. |
China Nominal GDP 1995-2019 |
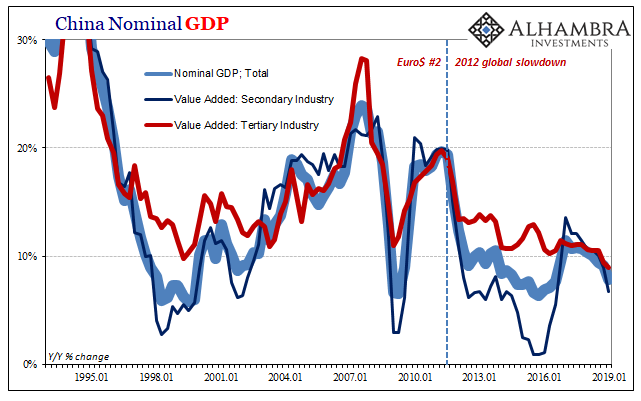
| According to the latest estimates provided by the NBS, value added in Secondary Industry grew (nominally) by just 6.8% year-over-year in Q1 2019. That’s down from 8.9% in Q4, and about 10.5% in each of the first three quarters of last year. At less than 7%, this is now about the same territory as 2014 when CNY began its downward trajectory. A realistic pathway back to full recovery no longer seems even slightly possible, though it may have briefly at the end of 2016 and the start of 2017.
Overall, then, total nominal GDP rose by just 7.8% year-over-year in Q1 beset by the reduced pace of Secondary Industry. That’s the lowest since Q3 2016 as Reflation #3 has certainly run its course and Euro$ #4 takes further hold on China. If rebalancing was a real trend, however, then the services sector, Tertiary Industry, would be largely unaffected. And that’s the way it is characterized under rebalancing, a bulwark of internal strength, the fruits of effective economic policies to defend China against external Western bungling. |
China Nominal GDP 1995-2019 |
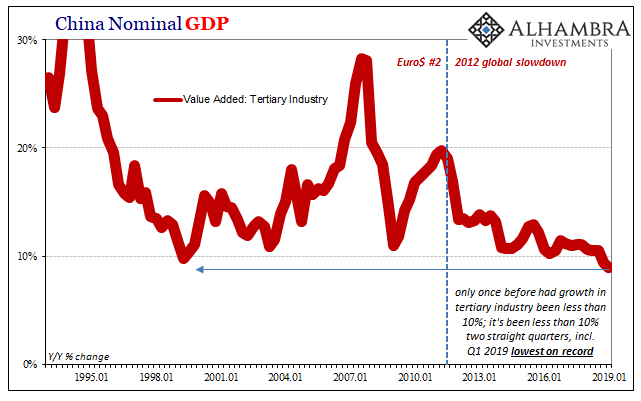
| Of course, that’s not at all what we find in the data. Instead, the service economy has been severely and constantly curtailed following Euro$ #2, too. The only difference from Secondary Industry is that it has slowed in more of a straight-line manner. There aren’t the same pronounced ups and downs here as there are associated with Secondary Industry.
Regardless, what that means is China’s economy is given less support than is imagined by what is also a damaging trend following 2011. How bad is it? Up until last year, only once, in just one single quarter had growth in the services economy fallen out of double digits (the end of the Asian flu in Q2 1999). In Q4 2018, year-over-year growth in Tertiary Industry was 9.5%, the lowest on record. In Q1 2019, now 9.0% and a new lowest on record. More important than either being record lows, the trajectory: 11.1% in Q3 and Q4 2017; 10.6% in Q1 and Q2 2018; 10.5% in Q3 2018; and now accelerating downside already in uncharted territory. That’s not trade wars. It is, however, a very clear sign of different effects from a eurodollar squeeze. The PBOC isn’t stimulating China’s economy because the problems in the global monetary system leave it much too large a monetary hole to overcome: |
PBOC Balance Sheet 2007-2019 |
These squeezes don’t happen all at the same time in the same places or even in the same way in a single place. China’s industry and manufacturing (secondary) are more directly and obviously knocked backward. That doesn’t mean the service sector is unaffected. Quite the contrary.
Under these terms, CNY DOWN = BAD is the only relevant equation. It’s all about risk, and if China’s services economy isn’t holding up, and it isn’t, there couldn’t have been globally synchronized growth leaving anyone who bet on China leading that trend exposed all over again to disappointment (which quickly becomes escalating liquidity risk, cycles-within-cycles).
Without opportunity, there is only risk. Left over with too much risk, there can never be opportunity; which leaves these eurodollar problems to become self-reinforcing through time. Euro$ #4, not trade wars.
Tags: China Gross Domestic Product,currencies,economy,Federal Reserve/Monetary Policy,Markets,newsletter


