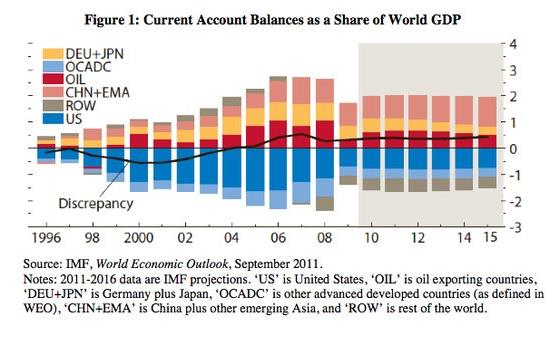
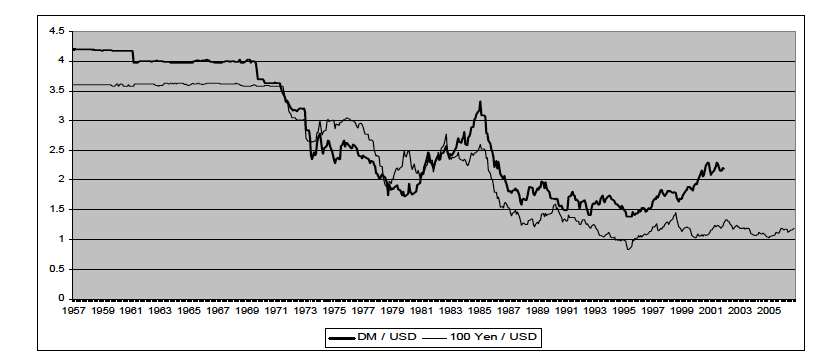
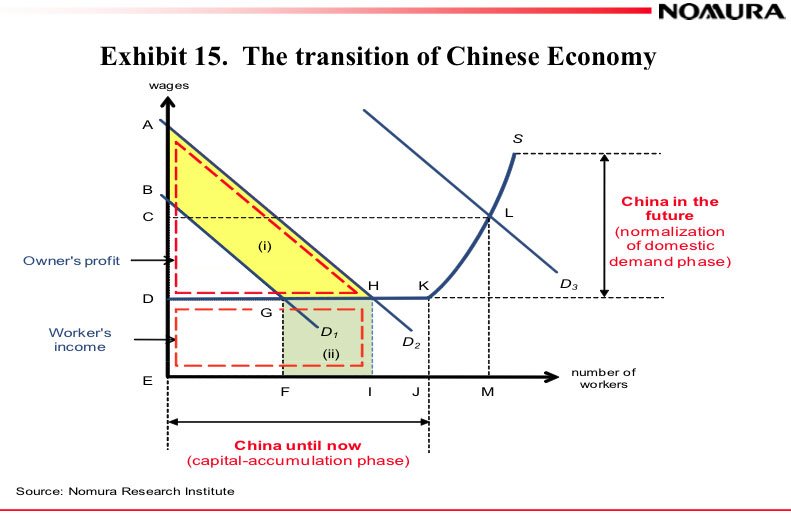
Like any other economic good, FX rates are driven by supply and demand. But what is behind that?
Basically there are two major drivers of FX rates. The first is the willingness to receive higher interest rates and higher returns in one country, these are the so-called capital flows. Especially by money market participants who bet on higher short-term interest rates and move funds according to rates set by central banks. FX traders follow these movements.1. The second important criterion is current account and trade balances that determine trade flows. A country with a current account surplus represents safety and therefore countries with trade deficits need to pay higher interest rates than the ones with trade surpluses. This finally means that the surplus country has a dual advantage, it has trade surpluses and obtains interest payments from the deficit country. This is visible e.g. in today’s discussion around Germany – the surplus country – and Greece – the one with the deficit or – to give an example with different currencies – between Switzerland and Eastern Europe.
The Gross Domestic Product (GDP) is a proxy for capturing both current account balances and the development of spending and (implicitly) salaries – high increases of the latter two lead to higher interest rates. Be aware that in Western countries and with the outsourcing of manufacturing to China, GDP have become a measurement of consumption but less of production (more here).
If we had just these two simple criteria, we would not need flexible exchange rates: by the rule that higher interest rates compensate for trade deficits, FX rates would remain nearly stable, just like during the gold standard or the Bretton Woods era. Only when a country has structural surpluses and high savings then sometimes a currency must revalue. Countries with continues structural and savings “advantages” are the German Mark and the Swiss Franc. They were revalued a couple of times in the 1950s and 1960s and the pound was devalued.
However things changed. Since the late 1960s central banks and governments want to support their own economy with more jobs, or finance wars even if trade and public deficits follow (e.g. the Vietnam war). A first result was the Great Inflation in the 1970s, a period of big inflation differences between the U.S., the UK and other countries on one side and Germany and Switzerland on the other side. This period let the importance of real, i.e. inflation-adjusted, exchange rates increase (see Real Effective Exchange Rates, chapter 4).
After the year 2000, central banks claimed the defeat of inflation and left interest rates low. As a consequence, banks provided cheap credit to home owners of countries with trade deficits. During that period the only thing that counted were high (nominal) rates and yields on investments. FX rates of low-inflation countries like Japan and Switzerland fell. However, the outcome was the Great Recession.The two criteria above are the ultimate drivers, they are perceivable only after years. Therefore we identified five factors that assess currency movements earlier. These leading factors are
- financial or credit cycles;
- current account and trade balances;
- the financial position of a country;
- weaker or stronger risk aversion
- and the perpetual fact that with time, the difference between richer and poorer countries must become smaller.
The development of interest rate differentials that determines capital flows eventually follows these five leading factors.
1) Financial and Credit Cycles
Credit or sometimes Joseph Cycles are boom and bust cycles, especially in real estate. These cycles are based on rational expectations, a logical reasoning that economic actors use. Events like the financial crisis of 2008 or Volcker’s fight against inflation are able to completely destroy previously valid rational expectations. The destruction of the rational expectation that real estate prices always rise in the U.S. led to a bust and a birth of a new rational expectation that assets and real estate prices e.g. in Switzerland always increase. Investors and FX rates followed the rational expectation. Trading algorithm often incorporate rational expectations as basic algorithmic logic that creates fair valuation out of fundamental macro events (see more in part 2).
During a boom cycle, higher property values help consumers to feel more wealthy and to spend more. This leads to increasing local production, especially when the country is a relatively closed economy like the U.S. or Japan. In order to take profit on rising consumer spending, funds and investments are directed to this country (see the Asset Market Model, chapter 10), so stock prices rise. With time, unemployment goes down, wages rise and inflation shows up. In the longer term this triggers central banks to increase interest rates (chapter 5). If a central bank does not hike rates enough, inflation can persist and the currency depreciates due to negative real rates and funds leave the country again. On the other side, high interest rates prevent local firms from obtaining finance investments at a sufficiently low price.
Credit cycles typically consist of two lags, one with seven years of boom and one with seven years of bust (or deleveraging), as shown in the following graph. Therefore, they obtained the name “Joseph cycle”, from the biblical prophet Joseph that speaks of seven good and seven bad years. It shows that in January 2012 the U.S. had already passed 3 1/2 years and had another 3 years to go in the bust/deleveraging phase of the credit cycle – while the U.K. and Spain maybe even have 5 years to go. Read more about Credit/Joseph cycles, or more generally called “financial cycles“ from one of the leading authors, Claudio Borio of the Bank of International Settlement (BIS).
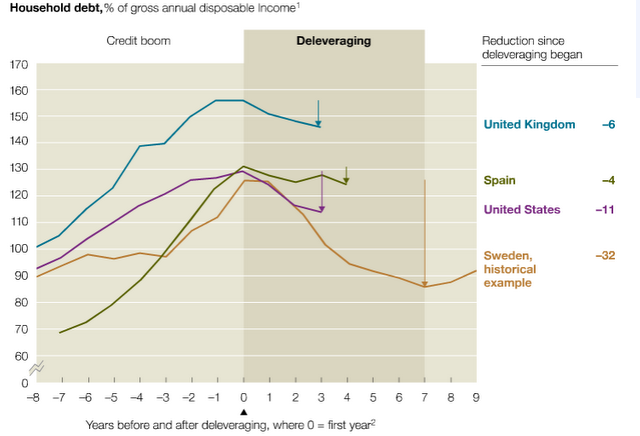
source: McKinsey in January 2012
The fallacy of boom cycles is that – thanks to higher valuations of assets – savings are considerably reduced. The opposite happens during the bust cycles: austerity reigns and savings rise. This leads to the next point.
2) Trade balances and savings
Trade balances reflect the ability of local private and public companies to make higher profits compared to the international competition. While local goods are paid for with foreign currency, the latter shows a higher supply and must depreciate. Even if the goods are sometimes paid in foreign currency, exporters and investors prefer to repatriate foreign profits, caused by a home bias connected with natural risk aversion against the holding of foreign currencies.
Trade and current account surpluses, however, are indirectly the result of high savings (see details of the relationship of current accounts and savings in chapter 12). Saving typically happens in the local currency and again causes higher amounts of the local currency to persist while monies of countries with lower savings rates are spent and disappear.
Some countries like Germany, Switzerland, China and Japan (until 2007) showed consistent trade surpluses thanks to a high savings rate, higher investments and advantages in productivity, visible in the purchasing power parity (see chapter 3). Higher productivity leads to lower production costs, a stronger currency to lower import costs, resulting in lower inflation, lower rates and to a stronger currency. This theoretical “virtuous cycle” is reflected in the interest rate parity (see chapter 14).
Over the very long-term (beyond the 7 years of a Joseph Cycle lag) currencies of countries with continuing (also called “structural”) trade surpluses must appreciate, while the ones of deficit countries and a low savings rate must fall (see more in chapter 11).
Historically there were slightly different economic views: Keynesians even thought that current account surpluses were self-correcting.
Monetarist models assume that current account surpluses expand the money supply and thus stimulate demand: this was clearly true under the Gold Standard. Keynesian models (with fixed exchange rates) view a current account surplus as an injection of aggregate demand, which ultimately stimulates imports and so leads towards a correction. (source Bank for International Settlement)
High inflation, however, but a weak current account often implies that people prefer not to save in the local currency but in a foreign one with lower inflation.
Sometimes it makes sense for exporters to reinvest profits in a boom phase of a foreign credit cycle. In this case profits remain invested abroad, the capital account of the balance of payments (see chapter 6) shows high capital outflows and leads to a so-called carry trade (see chapter 7), often intensified with margin debt taken in the currency of the surplus country. Between 2002 and 2007 this led to a bust cycle (or at least weak growth) of surplus countries like Japan, Germany and Switzerland and the use of the yen and the Swiss franc as the funding currencies of carry trades.
Similarly, a bust of a foreign credit cycle leads to a reverse carry trade (chapter 7): the capital account of the surplus country shows big inflows (see the Swiss balance of payments and the big inflows after 2008).
From the end of the 1960s and finally with floating exchange rates, deficit countries paid higher interest rates. This “original” form of carry trade helped to counter the “repatriation of profits effect” and limited volatility of exchange rates. On the other hand, it weakened the financial position of the deficit state (see next point), especially if the interest paid was higher than inflation.
A main driver of the weak U.S. trade balance is rising oil prices that take a major part of U.S. imports, while other countries like Switzerland, Germany, Japan and recently China are able to profit from shorter distances and/or better (commuter) infrastructure. Other countries with bigger distances like Canada, Russia, Australia or Brazil possess enough oil or other commodities that they can compensate for rising costs of imported oil, these are the so-called “commodity currencies”.
3) Availability of funds/financial position and some related FX history
Many less developed countries, but also euro countries like Greece or Spain (but not Italy) do not have enough local capital to boost investments; they need foreign funds. The foreign capital – often called “hot money”- leaves such a country far more quickly. This exacerbates risk aversion (see next point) and weakens the currency.
Until 1950, the United States and partially the UK were the countries that had a big capital base. Consistent current account surpluses help to accumulate capital. During the Bretton Woods era from 1950 to 1971, Germany, Japan and Switzerland were able to transform current account surpluses into private wealth and big gold reserves. They achieved a good capital base, while the U.S. and the UK lost reserves.

sources Left: Toyoyuki Sameda, Right: Blanchard, et al. Macroeconomics
Inflation-adjusted growth in these countries was higher, especially inflation was lower. American capital flooded into them, when the exchange rates were allowed to float with the end of the Bretton Woods system.
During this period, central banks feared interventions in currency markets because buying foreign monies could be done only with higher money supply, that again fueled local inflation (see why). Monetarist theories that fixed yearly increases of money supply dominated central banks.
During the first phase of the post-Bretton Woods period the Swiss franc appreciated by 40% and the German Mark by 30% against the dollar. The appreciation stopped when Volcker increased U.S. interest rates in 1982; the dollar became interesting again as an investment currency.
Emerging markets, especially Latin America, were not able to achieve consistent current account surpluses in the 1970s because their exports were mostly based on commodities (“dutch disease”). Volcker won against inflation in 1982 with high interest rates in the U.S. That crowded out investments in emerging markets during the 1980s. It led to an era of low global growth between 1981 and 1994, but to stronger development in the U.S. and a lost decade in Latin America. Japan, however, improved productivity and was able to increase capital, its international investment position (see chapter 8) and reserves – in the form of U.S. treasuries.
The bust of the Japanese bubble led to some more years of slower growth in Asia and other emerging markets and to more strong years of the United States, that culminated in the dot-com bubble in the year 2000.
After the crisis of 1997/1998, state-led economies in China and other Asian countries decided to increase their reserves and their local capital base via current account surpluses and to limit wage increases, so that they did not repeat the same errors as Latin Americans during the 1970s. Until 2011 the Chinese were in a capital accumulation phase, which should be followed (one day) by a phase of stronger consumer spending.
The United States remains, despite its weak current account, the country with the strongest availability of funds.One reason is the current account deficit is reduced by investment income, mostly equities, from overseas. On the other side it is the major reserve currency for many foreign central banks. For more information see our chapter on wealth and the international investment position (chapter 8).
4) Risk aversion
The United States not only possesses the largest amount of capital, but contributes a large part to world consumption. High inflation and high oil prices hamper American consumption. By the tradition that caused oil price shocks in the 1970s, markets are strongly driven by the U.S. consumer and U.S. investment houses, and so are trading algorithms: a strong U.S. economy helps against risk aversion, while high Chinese or emerging market growth often increases oil prices, inflation, market volatility and, therewith, possibly also risk aversion.
Global growth expectations for 2013 are far lower than in 2010 or 2011, but thanks to U.S. improvements, markets shrugged this off, while the strong global growth in 2010/2011 combined with weakness in the euro zone led to a collapse in markets in August 2011.
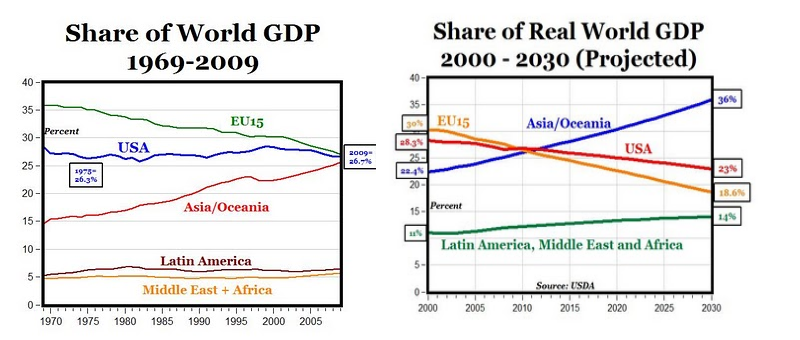
5) The Perpetual Alignment of Rich and Poor Countries
With time, the difference between rich and poor countries must become smaller, as visible in the following
source Mark J. Perry
Developed countries must become smarter to maintain higher salaries. Better education for more people leads to technological progress and helps to boost growth, while the scarcity of natural resources hampers it.
Thanks to modern communication, work can be outsourced far more easily than during the “false rise of emerging markets” in the 1970s, this despite increasing oil and transport costs. Therefore, the gap between rich and poor countries must become smaller, while corruption or political insecurities may delay this development.
Between 1950 and 1980, Europe managed to reduce the difference to the U.S, while since the year 1998 the gap between developed and emerging markets has quickly decreased with the consequence that oil and commodities have become a scare resource and an issue for growth.
Smaller differences between rich and poor does not mean that exchange rates of emerging market countries must always appreciate. On the contrary, countries with current account deficits, rising wages and high inflation, must depreciate with time. One bad example is the continuing depreciation of the Indian Rupee, while the Chinese Renmimbi has appreciated against the euro since 1996, despite rising Chinese inflation and rising salaries. We will present the reasons behind this in Crowther’s balance of payments theory (chapter 13).
One important task of currency analysts is to evaluate if the current Brent oil price correctly reflects Chinese, Indian and other developing nations’ future growth correctly. An alignment between poorer countries like China and richer ones like the United States reflected in the Brent oil price has a great influence on trade balances and currencies, while the Renmimbi itself is not fully convertible.
Chinese growth rates between 12% and 18% in 2007/2008 combined with low U.S. rates drove the oil price up to 150 US$, while growth of 2-4% let it fall to 30$ a barrel in 2009. Does the current price of 100-110$ for Brent oil point to a future Chinese growth rate of 6% (oil and commodity currencies – bearish) or better 8% (oil and commodity currencies -bullish)?
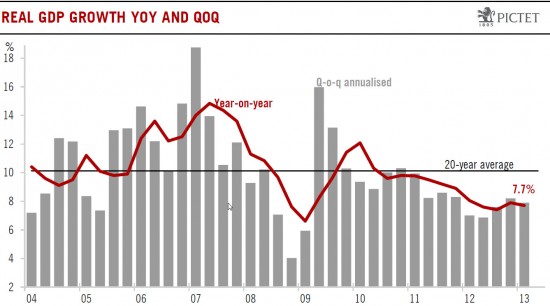
Chinese growth 2004-2013 (source Pictet)
Most recently, countries with expensive education systems like Sweden, Norway, Finland, Germany or Switzerland prove that human capital has become another important factor in the competition among developed countries and their currencies, maybe the factor for the next decades (see immigration and human capital, chapter 15).
Read chapter 1.2. to understand how FX prices are based on these five factors.
- We do not believe that market participants act according to long-term bond yields. Apart from central banks they are mostly driven by inflation and risk-averse people that prefer investing in their own currency [↩]


