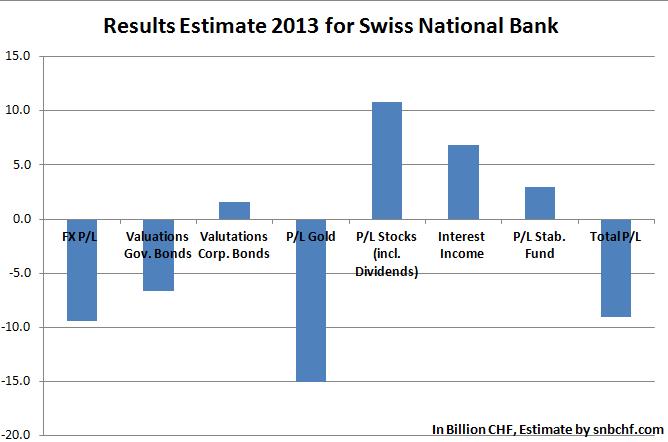
SNB Results per asset class in 2013
We compare the actual results with our rough estimate of January.
Losing positions:
- Exchange rate-related losses: -10.5 bln. CHF, the losers were yen positions (7 bln. loss), the dollar (3.2 bln. loss) and the AUD (ca. 2 bln. loss). The stronger EUR (from 1.2078 to 1.2290 CHF) helped to achieve 3.5 bln. gains
- Valuations of government bond holdings: -8.7 bln. CHF Our estimate was 3 bln. loss on US Treasuries and 2.2 bln. loss on German bonds.
- P/L for gold: -15.2 bln. CHF
- CHF positions are very small compared to the ones above, therefore losses are small, too: 96.2 million CHF.
- The losing positions add up to a loss of 35 billion francs.
Winning positions:
- P/L for equities (excl. dividends): +13.7 bln. CHF Our January estimate was +10.83 bln. CHF – As opposed to bond and FX positions (e.g. here), the central bank does not give details about its equity positions. Therefore we based our very rough estimate on market capitalization for global equity markets.1 The 12% equity share has risen to nearly 16% thanks to good equity and bad bond/gold performance.
- Interest income on bonds and cash positions: +6.9 bln. CHF (our estimate was 6.8 bln., as extrapolation of Q3 preliminary results)
- Dividend income: 1,7 bln. CHF
- Interest expenses: 11 million CHFThe UBS Stabilization Fund: +3.4 bln. CHF.
Seigniorage: Compared with a total balance sheet of 490 bln. and the two types of incomes, the yield on total assets was 1.7%, while the yield on liabilities (aka interest expenses) was a stunningly low value of 0.002% to the balance sheet.
The detailed profit and losses for each position can be found here
- We divided the 12% equity share of end 2012 into 1.5% German DAX (slight bias to neighbor-ship to Switzerland), 4.5% S&P 500, 0.6% Nikkei, 2.4% Emerging Markets and 3% other markets. [↩]


