On this page we compare the most important Swiss economic with the ones of the euro zone in the recent years and we give a view and link to the monetary policy assessments.
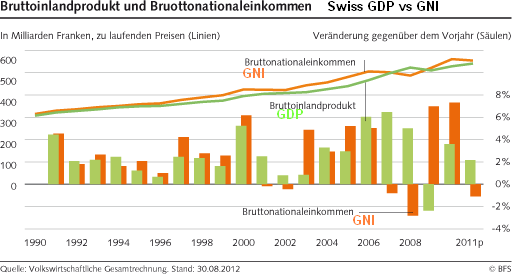
Overview of Nominal Swiss GDP and Gross National Income (GNI)
Development of Swiss GDP vs. GNI
SNB quarterly monetary assessments and comparison with euro zone
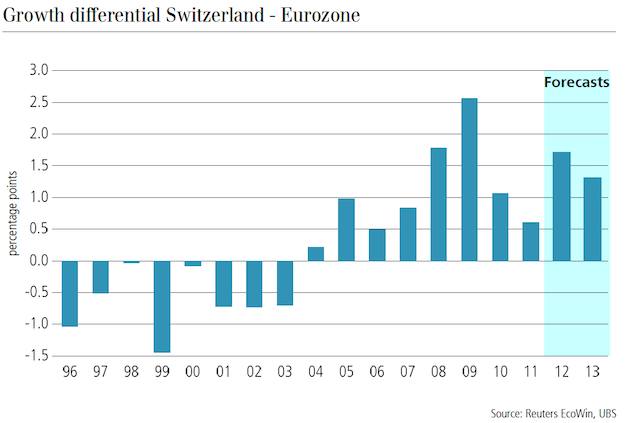
The most astonishing piece of data is that between 2006 till 2008, the SNB kept the Libor rates far lower than the ECB rates, but Swiss growth was far stronger than in the euro zone. This lead to an undervalued franc.
| SNB monetary assessment | 3M CHF Libor | ECB Rate | EUR/CHF (at SNB assess.) | Swiss Real GDP Growth (QoQ) | Euro zone Real GDP Growth (QoQ) | Swiss CPI MoM (avg. over quarter) | Swiss Unemploy. seasonally adjusted | Swiss Taylor Rate |
|---|---|---|---|---|---|---|---|---|
| 2014 Q2/June | 0.00%-0.25% | 0.15% | ||||||
| 2014 Q1/March | 0.00%-0.25% | 0.25% | ||||||
| 2013 Q4/Dec | 0.00%-0.25% | 0.25% | ||||||
| 2013 Q3/Sept | 0.00%-0.25% | 0.25% | ||||||
| 2013 Q2/June | 0.00%-0.25% | 0.50% | ||||||
| 2013 Q1/Mar | 0.00%-0.25% | 0.75% | ||||||
| 2012 Q4/Dec | 0.00%-0.25% | 0.75% | ||||||
| 2012 Q3/Sept | 0.00%-0.25% | 0.75% | ||||||
| 2012 Q2/june | 0.00%-0.25% | 1.00% | 1.2010 | +0.1% | 3.2% | -0.10% | ||
| 2012 Q1/March | 0.00%-0.25% | 1.00% | 1.2071 | +0.7% | 0.0% | +0.2% | 3.1% | -0.49% |
| 2011 Q4/Dec | 0.00%-0.25% | 1.00% | 1.2240 | +0.5% | -0.3% | -0.2% | 3.1% | -0.49% |
| 2011 Q3/Sept | 0.00%-0.25% | 1.50% | 1.2075 | +0.3% | +0.1% | -0.3% | 3.0% | 1.35% |
| 2011 Q2/June | 0.00%-0.25% | 1.25% | 1.2051 | +0.5% | +0.1% | 0.0% | 3.1% | 1.75% |
| 2011 Q1/March | 0.25% | 1.00% | 1.2599 | +0.6% | +0.8% | +0.2% | 3.5% | 2.01% |
| 2010 Q4/Dec | 0.25% | 1.00% | 1.2774 | +0.4% | +0.3% | +0.2% | 3.6% | 1.05% |
| 2010 Q3/2010 | 0.25% | 1.00% | 1.3283 | +0.8% | +0.4% | -0.2% | 3.8% | 0.95% |
| 2010 Q2/June | 0.25% | 1.00% | 1.3619 | +0.7% | +1.0% | 0.1% | 4.0% | 0.85% |
| 2010 Q1/March | 0.25% | 1.00% | 1.4400 | +0.8% | +0.2% | 0.0% | 4.1% | 2.16% |
| 2009 Q4/Dec | 0.25% | 1.00% | 1.5000 | +0.4% | +0.4% | +0.2% | 4.1% | 0.80% |
| 2009 Q3/Sept | 0.25% | 1.00% | 1.5100 | +0.9% | +0.1% | -0.2% | 3.9% | -2.23% |
| 2009 Q2/June | 0.25% | 1.00% | 1.5100 | +0.2% | -2.5% | +0.4% | 3.4% | -1.53% |
| 2009 Q1/March | 0.25% | 2.00% | 1.5300 | -1.4% | -0.1% | -0.3% | 3.0% | -0.44% |
| 2008 Q4/Dec | 0.5% | 3.25% | 1.5500 | -1.6% | -1.9% | -0.5% | 2.6% | 8.51% |
| 2008 Q3/Sept | 2.75% | 4.25% | 1.5700 | -0.3% | -0.5% | -0.1% | 2.5% | 2.00% |
| 2008 Q2/June | 2.75% | 4.00% | 1.6081 | +0.7% | -0.4% | +0.6% | 2.5% | 9.93% |
| 2008 Q1/March | 2.75% | 4.00% | 1.5600 | +0.6% | +0.7% | +0.2% | 2.5% | 8.04% |
| 2007 Q4/Dec | 2.75% | 4.00% | 1.6600 | +0.9% | +0.4% | 2.6% | 9.09% | |
| 2007 Q3/Sept | 2.75% | 4.00% | 1.6500 | +1.1% | +0.6% | 2.8% | 4.64% | |
| 2007 Q2/June | 2.75% | 3.75% | 1.6604 | +1.0% | +0.4% | 2.9% | 4.59% |
The SNB’s current monetary policy assessments are available under this link on the SNB site.
See more for


