The main drivers of demand for Swiss francs are the euro crisis and, even more, the behavior of American investors, who go out of the dollar in the fear of bad US economic data and/or Quantitative Easing (QE). Risk-friendly investors move into risky assets like stocks or currencies of emerging markets, while risk-averse investors fear inflation and buy inflation-resistant assets like Swiss francs.
When the Fed does QE, it buys US government bonds or mortgage-backed securities from non-banks like US pension funds or US insurances. The sellers obtain cash that they may invest in more risky assets. (similar approach, source Bank of England)
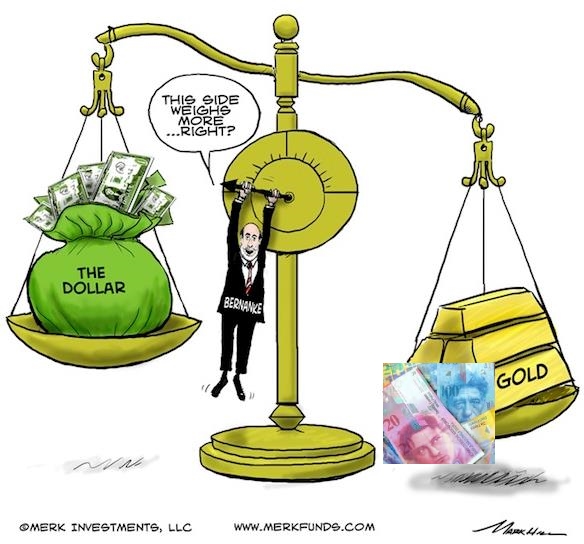
QE typically pushes down the dollar. Stocks and risk-on currencies like AUD, NZD or the ones from emerging markets appreciate because the Fed wrote a check to risk-friendly investors so that they may achieve high returns without risk (the so-called “Bernanke put”).
Safe-havens like the CHF, gold or the Japanese Yen move up because monetarist theories taught risk-averse investors that loose monetary policy will create inflation and that their assets are more secured against inflation when invested in gold or in assets in low-inflation countries like Switzerland or Japan. Moreover, to a certain extend, Swiss or Japanese equities are part of the investment portfolio of these insurances or pension funds. Finally there is an “imitating effect” in the portfolios of other investors.
UPDATE 2014
With the ECB move towards Quantative Easing, the rules in the game have inverted. Now the dollar still appreciates thanks to lower oil prices and the attempt of ECB and BoJ to devalue their currencies and generate more inflation.
Once again the SNB is under attack and must intervene.
Quantitative Easing
In some Keynesian definitions Quantitative Easing (QE) aims to incite companies and individuals to invest and consume more, respectively. Central banks most often realize QE via open market operations, during which they acquire government bonds. QE is the most extreme form of monetary easing and is applied when other easing methods, like lowering central banks rates cannot be applied any more because rates are already close to zero.
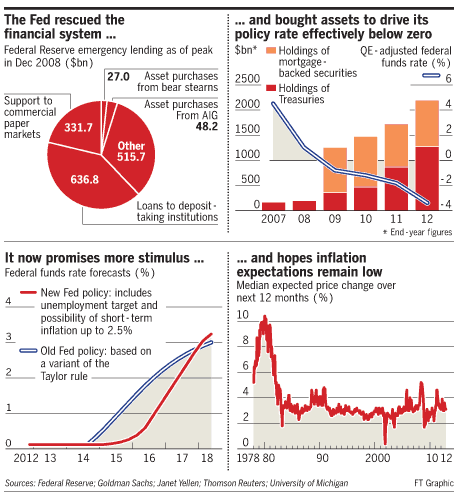
An overview is given in this graph from Credit Suisse. Following the approach in a paper by the Bank of England the Fed buys US government bonds or mortgage-backed securities from non-banks like US pension funds or US insurances. The sellers obtain cash that they may invest in more risky assets. According to this paper, QE does not induce a monetarist route; cash injection is not the main aim. According to this paper, lending is driven by credit demand and bank’s profitability versus risk in this lending process. In particular the central bank’s monetary base has nothing to do with the broad money supply, except that some people might borrow more because they “feel better”.
Thanks to the wealth effect, lower costs for capital and the lending effect, the sentiments of firms and households improve. This may lead to a virtuous cycle, more spending, more credit and more investments.
History of the Fed’s quantitative easing
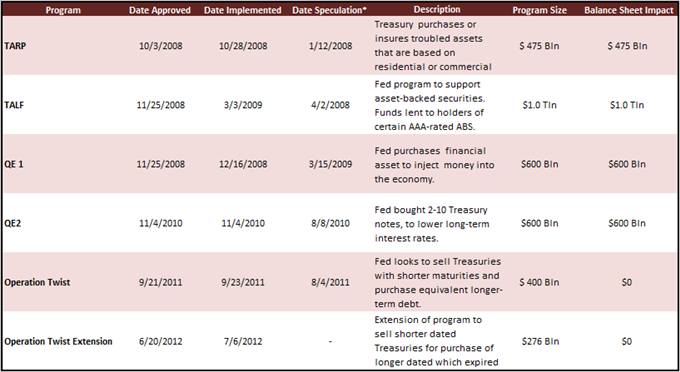
The following are the previous programs of quantitative easing in the United States:
QE3
The Fed said it will buy $85 billion a month in long-term Treasury bonds and mortgage-backed securities next year. The latest stimulus will replace the “Operation Twist” program, in which the Fed has been buying about $45 billion of long-term Treasurys each month and selling the same amount of short-term Treasury bonds. Source Marketwatch
With the purchase of US treasuries, the extension of Operation Twist inside QE3, the Fed emphasizes the wealth effect and the exchange route, the weakening of the dollar, because stocks, corporate bonds and foreign assets become more interesting.
With the purchase of mortgage-backed securities, the Fed lowers the cost of capital for home owners, but at the same time, it makes American real estate more interesting. This might result in a strengthening of the dollar (details in asset market model).
Effects of QE2 and QE3
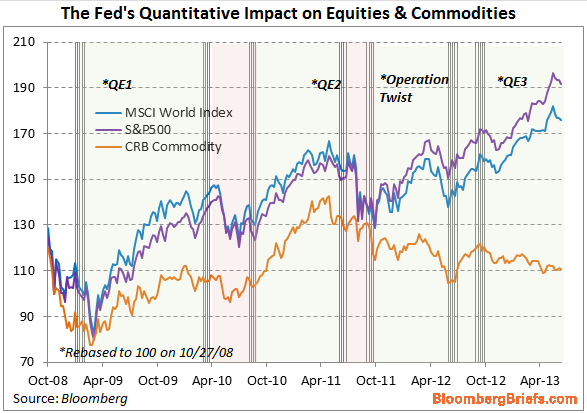
John B. Taylor said in June 2011 that QE1 was necessary to fight the panic in 2008/2009, but QE2 was overblown. His opinion was that the US were in a balance sheet recession.
For us, QE2 led to a sort of a boom and bust cycle, not in the US, but in China and other emerging markets. In 2011, the US slowed, but emerging markets and Germany strongly expanded. Eventually QE2 led to a temporary increase of inflation and in a bust, disinflation.
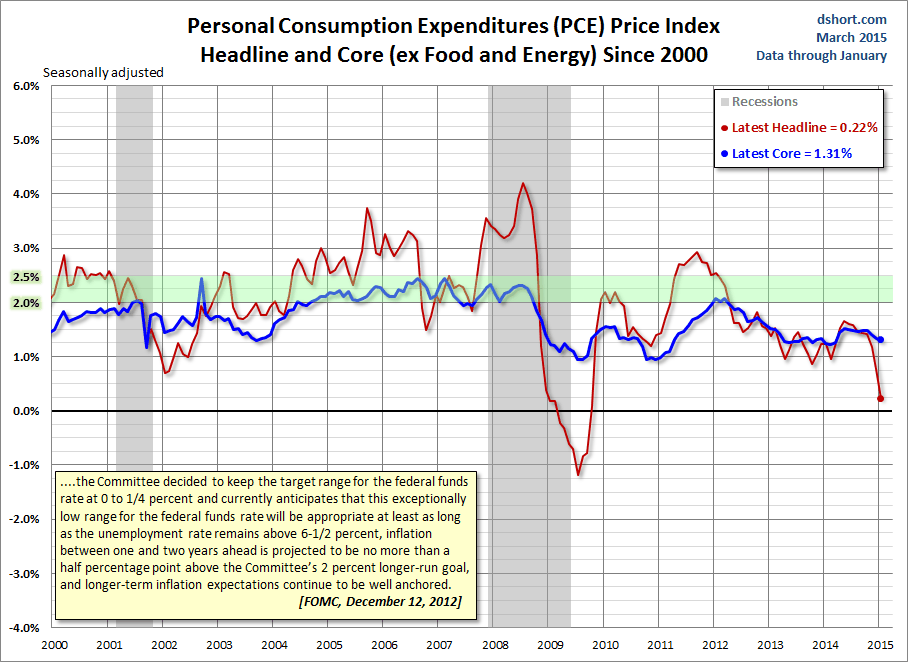
QE Indicators: Core PCE and Core CPI
For the Fed the most important indicator is the deflator of the GDP component “Personal Consumption Expenditure” excluding food & energy (Core PCE). The latest data has only been provided for the Q2 GDP release. With the Q3 GDP the indicator stood at 1.4%, higher than at the time of QE2, in September 2010, which was 1.3%.
Other Quantitative Easing Indicators
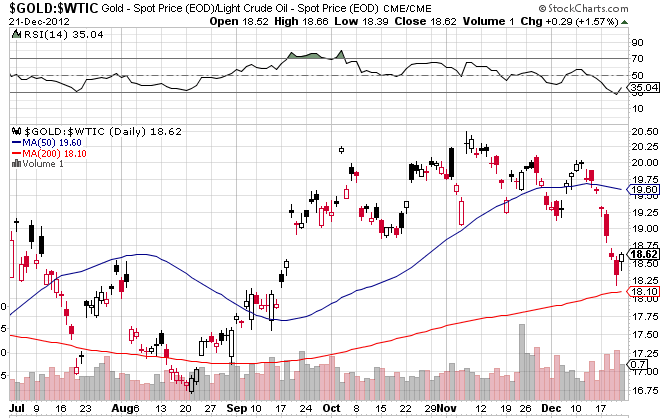
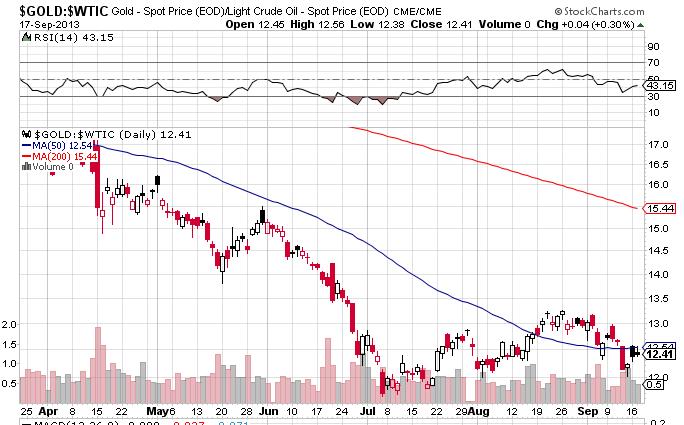
A rising gold-crude ratio (MA50) is an indicator of weak global and US growth, disinflation and an upcoming Quantitative Easing.
In December 2012, this ratio was still around 19.
By summer 2013, reduced fear and the recovering U.S. economy drove the ratio down to 12.
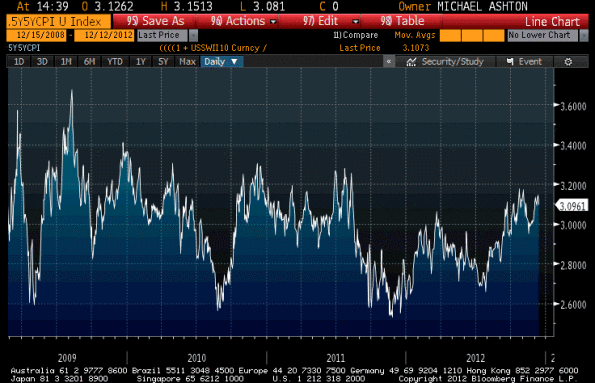
The Five year, Five year forward, “Fed’s Fav” represents inflation expectations derived from treasury inflation-protected securities (TIPS). The graph below appeared in the WSJ in June and is compared with Bloomberg data now.
Usually the Fed intervenes when inflation expectations are extremely low. The value of 3.096% for 5Y year TIPS rates in 5 years’ time, is relatively high, they suggest sticky inflation over 3%, far more than the 2.6% when QE2 was introduced in September 2010.
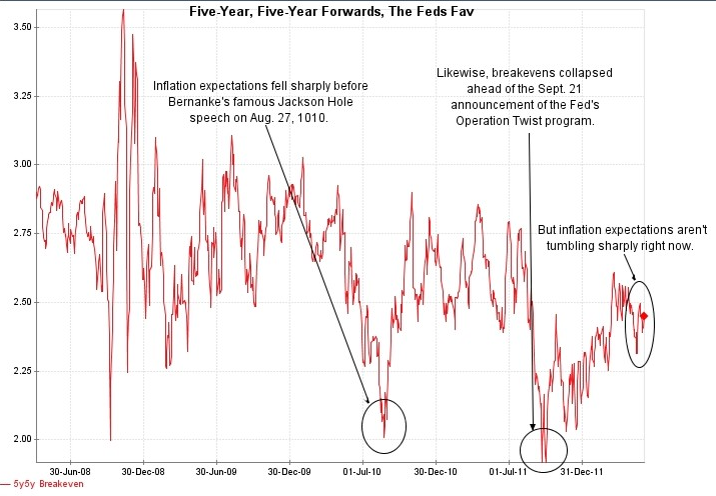
Fed's Fav Inflation Expectations ( hef="http://blogs.wsj.com/marketbeat/2012/06/05/betting-on-qe3-not-so-fast/">source Wall Street Journal) - Click to enlarge
Does Quantitative Help the Real Economy or just the Asset Markets?
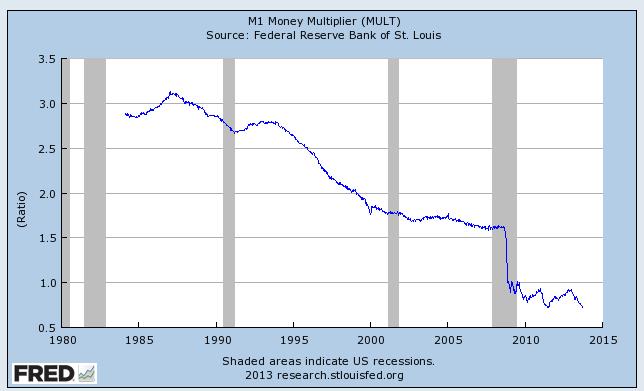
The big BUT: the Money Multiplier Smaller than 1
According to monetarist theories, central banks could influence money supply and credit supply via the monetary base. In Emerging Markets, this is still valid today. In developed nations like the U.S. and the euro zone, the monetary base has now only a very limited influence on money supply and credit.
Admittedly, money supply and more credit and loans still have an influence on inflation. But the monetary base and central banks are able to raise inflation any more. The money multiplier has become smaller than 1.
Richard Koo, the great American-Taiwanese economist compared the high increases of the monetary base to the money supply with a shop owner that reacts to slowing demand with higher supply. He decided to double the quantity of milk and meat offered in his little shop but – strangely for him – this did not increase demand.
According to Richard Koo’s theory of the balance sheet recession, the disadvantage of QE is that it only works in “Yang” phases, namely when the propensity to consume is considerably higher than zero and companies want to maximize profit. Koo reckons that QE is completely useless during a “Yin” or “balance sheet recession” phase, because companies and individuals prefer to reduce their debt instead of borrowing more, even when money is incredibly cheap. In order to avoid a deflationary spiral, namely when deflation leads to reduced spending, lay-offs and even weaker prices. The Japanese government has needed to do fiscal spending for nearly two decades now, pushing Japanese public debt to record levels.
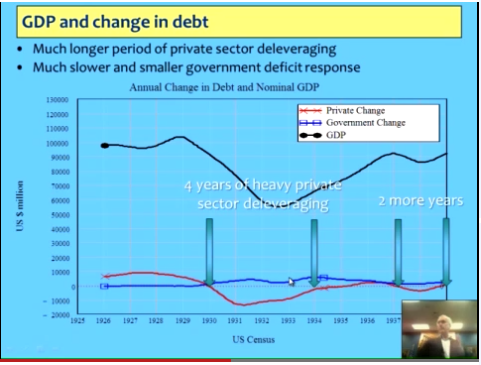
Koo’s arguments were valid during the great depression, when the United States went into six years of deflationary spiral. Government spending could have saved the country from the effects of the deflationary spiral, but President Hoover reduced state spending when the first recovery started in 1934. This led to another round of reduced spending and deflation in 1937. Most interestingly, Germany took the path of government spending – that unfortunately includes preparing for war – from 1934 on and was more successful than the US, at least in GDP growth terms.
Prof. Steve Keen of the University of Sydney, follows many of Koo’s arguments. As opposed to the Fed, Keen favors a reduction of American private debt, and similar to Richard Koo, he wants the government to spend. In this video he delivers his arguments to American policy makers, as far the fiscal cliff is concerned.
After the Fed supported American home owners with QE3, consumers started spending again, despite falling real wages. This effect has shown that as opposed to the Japanese (and probably also opposed to the Germans and the Swiss), American consumers like deficit spending, even if they have a high debt load. Therefore, the argument that the United States might follow Japan into a balance sheet recession, is currently not valid. The question is, is quantitative easing and the increase of both private and government debt really needed.
The following video by the Khan academy gives another nice overview of the differences between monetary and fiscal policy in the U.S. and Japan.


