In this post we present financial and credit cycles in history: due a weak credit cycle, Germany was a weak economy under many other weak ones.
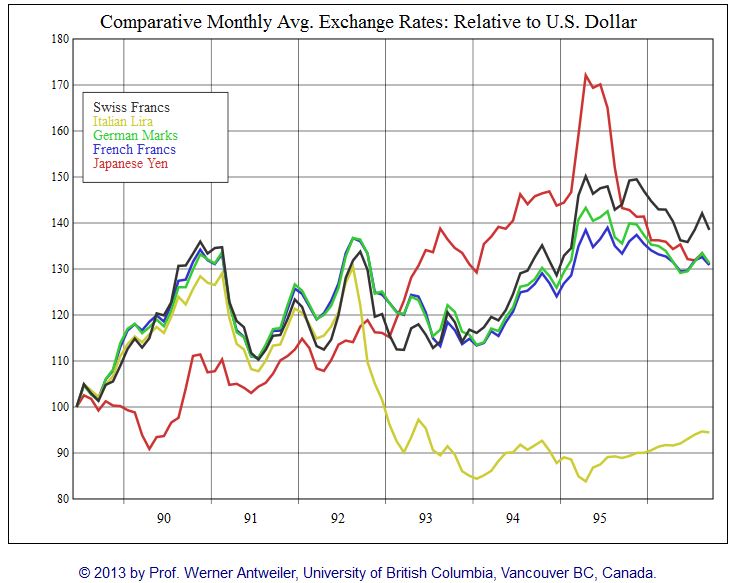
The strong German fiscal expansion after the reunification led to high inflation and a severe test of the European monetary system (EMS) and the Exchange Rate Mechanism (ERM) in 1992. Investors were attracted by high German short-term interest rates – for them high safety and high carry return at the same time. On Black Wednesday in September 1992, the Bank of England lost the battle against hedge funds led by George Soros. Italy and the UK left the ERM.
The prevailing high interest rates in the early 1990s caused banking and real estate crises in Sweden, Finland, the UK and Switzerland.
The bust phase of the German credit cycle from 1996 onwards
Another reason for the strong U.S. phase was that Germany was weak and capital flew into the United States. The credit cycle in Eastern Germany busted, because it was financed mostly with debt and did not have real productivity gains. Between 1996 and 2002, Germany paid 5% interest for 10 year government bonds, which is comparable to the high yields of Spain or Italy in 2011, but only had 0.5% real growth.
A decade of weak German spending, private debt reduction and huge current account surpluses followed.
The German Excessive Spending Bubble after the reunification in 1990
| Year | Public Deficit in billion | Deficit in % GDP | 10 yr Bund yield | Inflation |
|---|---|---|---|---|
| 1991 | 39.537 | 5.90% | 8.5% | 5.7% |
| 1992 | 42.019 | 6.28 % | 8% | 3.3% |
| 1993 | 45.767 | 8.92 % | 7% | 4.3% |
| 1994 | 47.968 | 4.81 % | 7% | 2.5% |
| 1995 | 55.597 | 15.90 % | 6.5% | 1.5% |
| 1996 | 58.467 | 5.16 % | 6% | 1.5% |
| 1997 | 59.754 | 2.20 % | 5.5% | 2.0% |
| 1998 | 60.491 | 1.23 % | 4.5% | 0.3% |
| 1999 | 61.257 | 1.27 % | 5% | 1.1% |
| 2000 | 60.182 | -1.75 % | 5% | 2% |
| 2001 | 59.142 | -1.73 % | 4.5% | 1.6% |
| 2002 | 60.748 | 2.72 % | 5% | 1.1% |
| 2003 | 64.426 | 6.05 % | 4% | 1.1% |
| 2004 | 66.204 | 2.76 % | 3.5% | 2.2% |
| 2005 | 68.514 | 3.49 % | 3.5% | 1.4% |
The German government finally decided to stop deficit spending and to implement austerity in 1997, also to enable the euro. Germany became the “sick man of Europe” and the German balance sheet recession started.
It was the German reunification that made the euro zone possible, because of its high costs, Germany was a weak economy under many other weak ones.
In China and the rising tiger economies a similar spending phase started in the early 1990s. This phase ended with the 1998 Asian crisis.
1989-2001: Bust of the Swiss, Swedish, Finnish and British Home Price Bubbles
With the weakened dollar in the late 1980s and the desire for investments in Europe, interest rates came quickly down at the end of the decade. Between 1988 and 1993 gross savings rates plummeted in the UK, Sweden and Finland. Finland saw the biggest decrease from 26% gross savings/GDP down to 15% in only 5 years. The consumption to GDP ratio rose quickly.
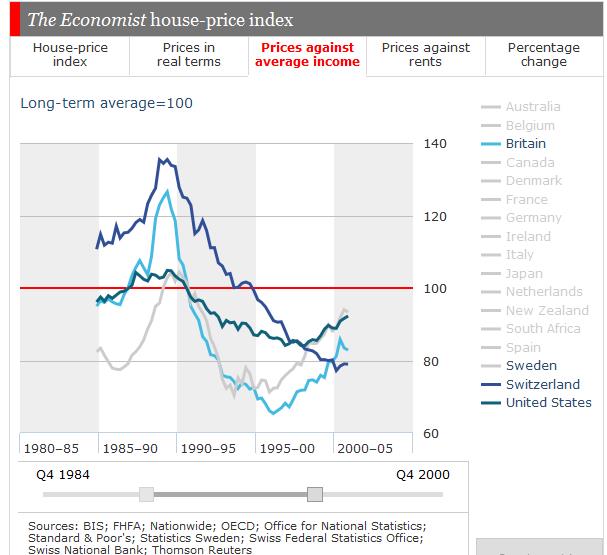
The British home price to income ratio fell far more quickly, after the exit from the ERM system home prices collapsed from 126.5% in 1989 to 65.4% in 1996. Prices in Sweden went up to 104% of income in 1989 and fell quickly to 70% in 1993. A quick banking rescue in Sweden saved prices from a further decrease. Swiss price-income ratios fell from a top of 135.4% in 1988 down to 76.9% in 2001. As opposed to the UK and Sweden, the bust phase took far longer – 13 years.
1991-2014: The Bust of the Japanese Housing Bubble
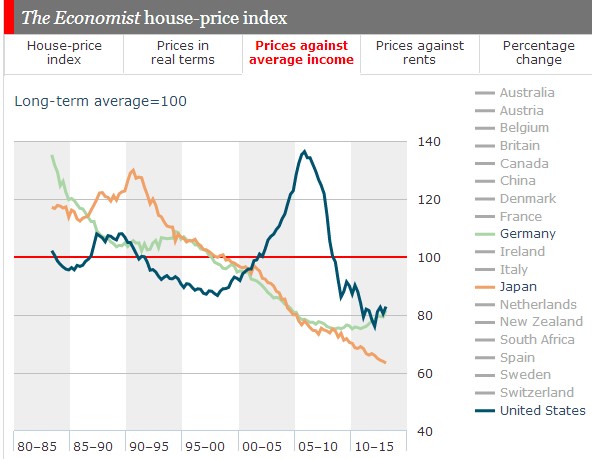 The recession of 1991 led to the Japanese balance sheet recession, a deleveraging phase from private debt that took at least 20 years. The deflation of the Japanese housing bubble took nearly as long as the German one and has not stopped yet: Price-income ratios (see graph) haven fallen from 134.6% in 1991 to 63.6%. Real prices rose from 100% in 1985 to 137.2% in 1991, but dropped to 66% today.
Japanese shunned investments in their home country but they financed the upcoming growth in Eastern Asia and they assisted Europeans and Americans in their phase of strong spending.
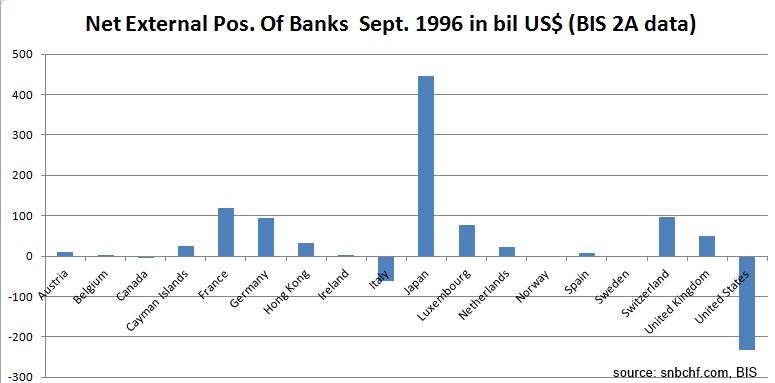
Despite of the rising external position (an indicator of the financial account), Japanese current account surpluses were higher.
The result was a strongly improving yen despite weak GDP growth. Only with the upcoming US dollar carry trade from 1995 onwards, the yen depreciated again.
<–Back to overview of financial cycles
See more for


