In this chapter we will look at the net international investment position (NIIP) for another two countries.
For the overview on the NIIP .
The Swiss International Investment Position
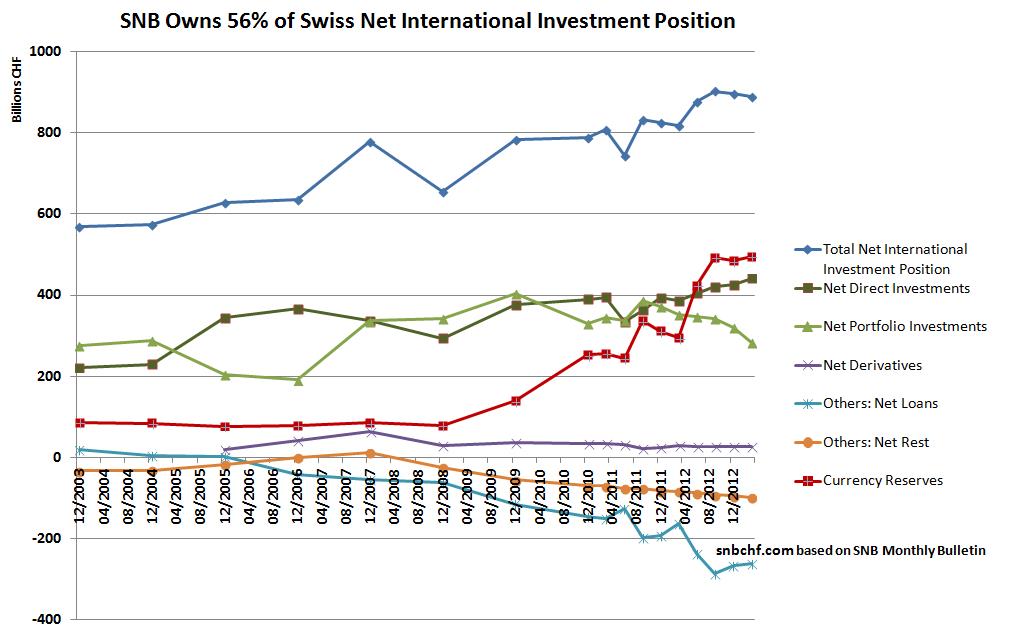
In the last decade the Swiss was continuously on the rise. It increased significantly between 2002 and 2007, when the cheap franc allowed for a strong current account surplus and improvements in the values of foreign direct investments (FDI) in emerging markets – albeit less in the United States (see next section). Swiss multi-nationals left the profits of their international subsidiaries in foreign currency.
In 2008 foreign assets saw a big trough, while foreign liabilities did not decrease that much. From 2009 on, the NIIP rose again because Switzerland profited from the recovery of the world economy. As opposed to Japan, the Swiss current account and trade surplus remained strongly positive.

Click on image to expand. Read more on the Swiss Net International Investment Position.
More details can be found in the post
Net Foreign Assets vs Net Foreign Debt
The term “net foreign assets” is typically used when foreign assets owned by locals exceed foreign liabilities (local assets owned by foreigners); hence, a positive NIIP. The opposite is “net foreign debt”1, the equivalent of negative NIIP.
The Net International Investment Position for Italy
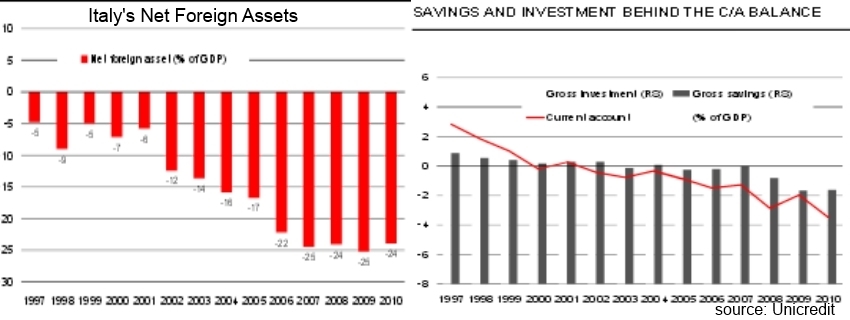
Since the introduction of the euro, Italian net foreign assets have strongly declined. Before 2000, the Italian current account was positive. Only in 2012 has become positive again, because consumers stopped spending, imports strongly decreased and exports improved. As a consequence of smaller spending, GDP fell by 2.7% in 2012, even if the external component was positive.

source Unicredit
For further details on the NIIP see the Balance of Payments Model.
For more details on the Swiss and Chinese NIIP.
Further References:
Eurostat: Net international investment position in % of GDP – annual data, Online Link
International Monetary Fund Stat:Current Query: International Investment Position (IIP), Net
See more for


