The PPP for EURCHF provided by UBS is based on producer prices and stood in June 2012 around 1.32.
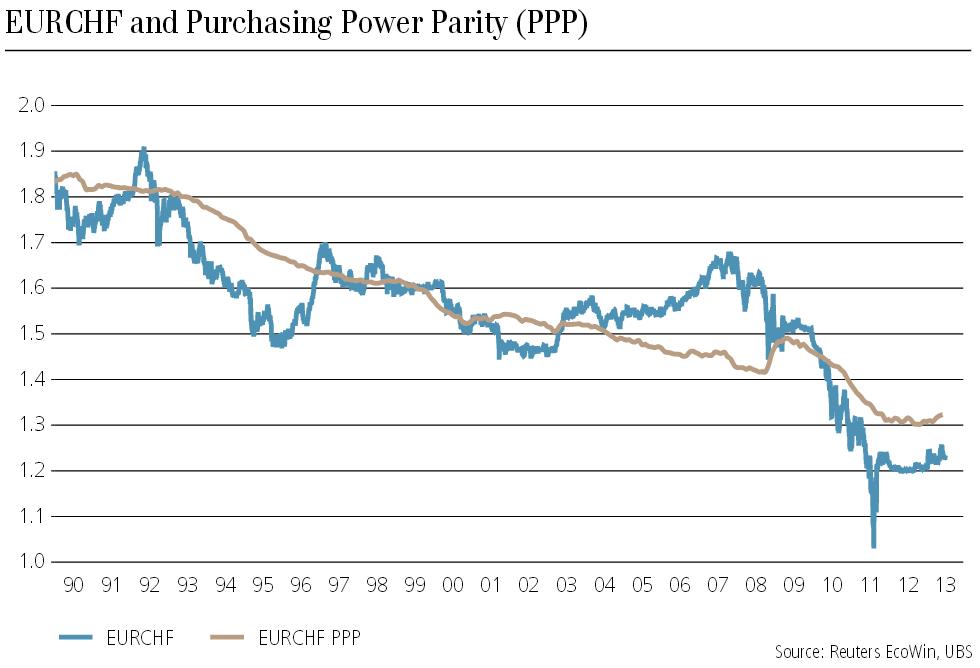
source UBS
The choice of the base year
Due to the higher European (producer price) inflation, the PPP fell by November to around 1.30. Still by June 2013 it is around 1.30. UBS’s PPP has 1990 as base year, it implicitly assumes that in 1990 the pair was correctly valued. The IMF typically uses the base year 1999 for the calculation of the its Real Effective Interest Rate. This is misleading because in 1999 the euro was very weak, at parity with the dollar.
The PPP value decreases each year in which Swiss PPI is lower than European PPI. The one from HSBC-Trinkaus is based on the producer price index (PPI). We assume that they use a base year in the late 1990s.
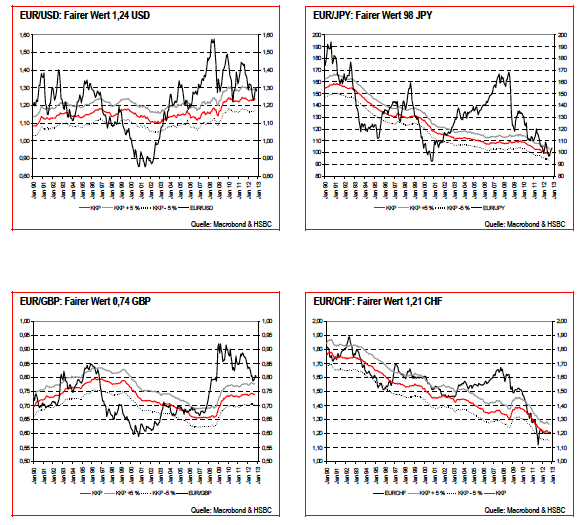
For them the AUD, NZD and NOK were strongly overvalued against the euro, but the franc is nearly at fair value. In September, both the dollar and the yen were fairly valued.
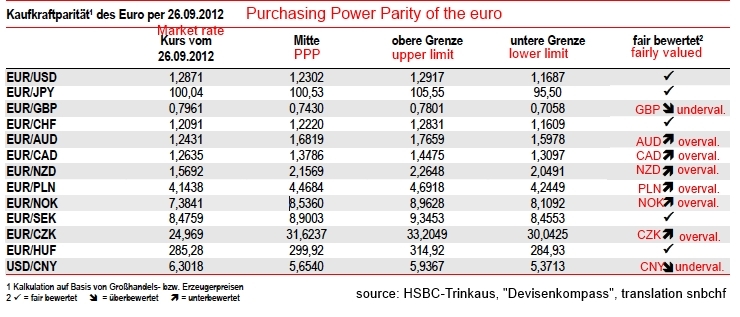 With the Chinese slowing, the reality has followed HSBC’s fair value anticipation, NOK, AUD and NZD have depreciated until August 2013.
By December 2012, both dollar and yen were in undervalued territory. Here the current fair values (“fairer Wert”):
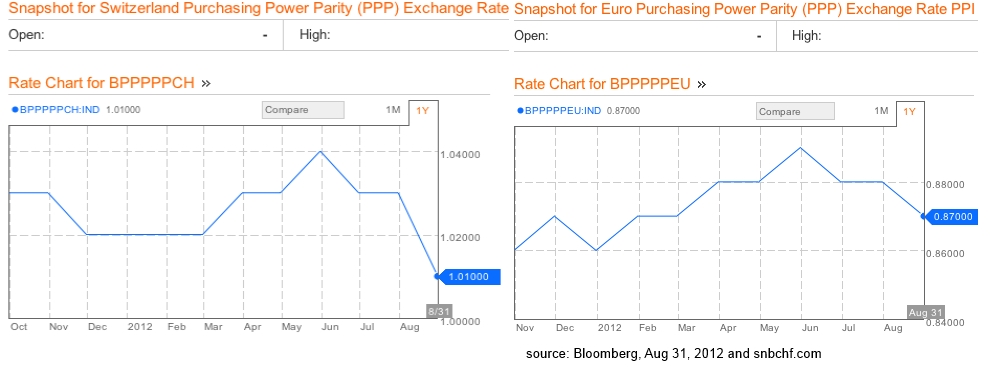
The Bloomberg PPP is based on the producer price indices (PPI).
The USD/CHF Bloomberg PPP stood at 1.01, but the one for USD/EUR is at 0.87 (inverted notation). This implies a PPP for EUR/CHF of 1.16, meaning that the Swiss franc is undervalued against the euro.
The differences among the valuations by UBS, Bloomberg, HSBC and KOF arise from the choice of the base year and base FX rate from which the formula above is started. In the Bloomberg evaluation the PPIs since the year 2000 are used. The base FX rate is the average exchange rate between 1982 and 2000, while the UBS evaluation seems to use the year 1990 as basis.
PPP based on Input Producer Prices vs. PPP based Output Producer Prices
The producer price index is typically based on output prices of local producers and on prices of exported goods. Statistics bureaus in certain countries like the UK are able to provide a differentiation between input and output price indices. The input PPI include costs of prime materials, capital and labor. UK data for September 2012 showed that the YoY input PPI fell by 1.2%, but the output PPI (for home sales) rose by 2.5%. The stronger sterling and cheaper energy prices helped the improve margins of British companies.
We think that a measure based on output producer prices or export prices would be the best for a comparison of tradable goods.
Summary
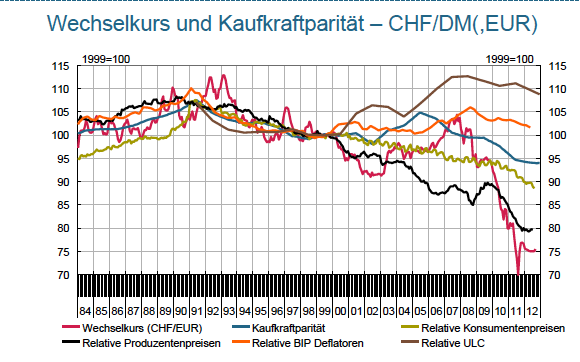
The following graph from the Swiss KOF institute gives a comparison of the different PPP measures for the EUR/CHF rate on the base year 2000 (and previously DEM/CHF, which is actually quite misleading).
- Exchange rate (CHF/EUR), red
- Relative Producer Prices (PPP based on PPI, not distinguished between exports and local consumption), black
- Purchasing Power Parity (PPP according to OECD), blue
- Relative GDP deflator, orange
- Relative Consumer Prices (PPP based on CPI), dark green
- Relative unit labor costs (ULC of the OECD), brown
The purchasing power parity gives an understandable explanation if a currency is over- or undervalued. Even if we decide to use the PPP based on producer prices, still a lot of interpretation remains, for example, which base year should be used. Several factors, especially credit cycles (see first chapter), but points like immigration (see chapter 15) may divert the nominal FX rate from the “fair value” indicated by the PPP.
Literature:
Balassa, B. (1964), “The Purchasing Power Parity Doctrine: A Reappraisal”, Journal of Political Economy 72 (6): 584–596, doi:10.1086/258965.
Dornbusch, R. (1988), “Purchasing Power Parity”, The New Palgrave Dictionary of Economics (Reprint ed.), London: Palgrave Macmillan, ISBN 1-56159-197-1.
Samuelson, Paul A.. A. (1964), “Theoretical Notes on Trade Problems”, Review of Economics and Statistics 46 (2): 145–154, doi:10.2307/1928178.
Samuelson (1994). “Facets of Balassa-Samuelson Thirty Years Later,” Review of International Economics 2(3), pp. 201–26. Abstract defining the Penn effect
See more for


