This basic economic principle that private savings finance public deficit and current account surpluses is of crucial importance for understanding the euro crisis and the drivers of government bond yields.
In the introductory chapter we said:
Trade balances reflect the ability of local private and public companies to make higher profits compared to the international competition. While local goods are paid with foreign currency, the latter shows a higher supply and must depreciate. Even if the goods are sometimes paid in foreign currency, exporters and investors prefer to repatriate foreign profits, caused by a home bias connected with natural risk aversion against the holding of foreign currencies.
High trade and current account surpluses, however, are indirectly the result of high savings. Saving typically happens in local currency and causes again higher amounts of the local currency to persist while monies of countries with lower savings rates are spent and disappear.
In the following we want to understand the relationship between current accounts and savings. These concepts are important:
The domestic private sector are local households and firms:
By Rob Parenteau, CFA, sole proprietor of MacroStrategy Edge, editor of The Richebacher Letter, and a research associate of The Levy Economics Institut
For the economy as a whole, in any accounting period, total income must equal total expenditures. There are, after all, two sides to every transaction: a spender of money and a receiver of money income. Similarly, total saving out of income flows must equal total investment in tangible capital during any accounting period.
For individual sectors of the economy, these equalities need not hold. The financial balance of any one sector can be in surplus, in balance, or in deficit. The only requirement is, regardless of how many sectors we choose to divide the whole economy into, the sum of the sectoral financial balances must equal zero.
For example, if we divide the economy into three sectors – the domestic private (households and firms), government, and foreign sectors, the following identity must hold true:
Note that it is impossible for all three sectors to net save – that is, to run a financial surplus – at the same time. All three sectors could run a financial balance, but they cannot all accomplish a financial surplus and accumulate financial assets at the same time – some sector has to be issuing liabilities.
Since foreigners earn a surplus by selling more exports to their trading partners than they buy in imports, the last term can be replaced by the inverse of the trade or current account balance. This reveals the cunning core of the Asian neo-mercantilist strategy. If a current account surplus can be sustained, then both the private sector and the government can maintain a financial surplus as well. Domestic debt burdens, be they public or private, need not build up over time on household, business, or government balance sheets.
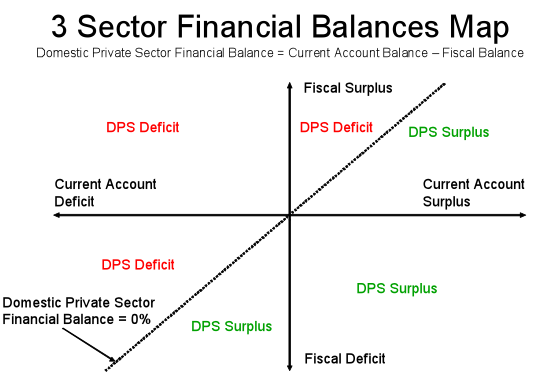
Again, keep in mind this is an accounting identity, not a theory. If it is wrong, then five centuries of double entry book keeping must also be wrong. To make these relationships between sectors even clearer, we can visually represent this accounting identity in the following financial balances map as displayed below.
On the vertical axis we track the fiscal balance, and on the horizontal axis we track the current account balance. If we rearrange the financial balance identity as follows, we can also introduce the domestic private sector financial balance to the map:
That means at every point on this map where the current account balance is equal to the fiscal balance, we know the domestic private sector financial balance must equal zero. In other words, the income of households and businesses just matches their expenditures (or alternatively, if you prefer, the saving out of income flows by the domestic private sector just matches the investment expenditures of the sector). The dotted line that passes through the origin at a 45 degree angle marks off the range of possible combinations where the domestic private sector is neither net issuing financial liabilities to other sectors, nor is it net accumulating financial assets from other sectors.
Once we mark this range of combinations where the domestic private sector is in financial balance, we also have determined two distinct zones in the financial balance map. To the left of the dotted line, the current account balance is less than the fiscal balance: the domestic private sector is deficit spending. To the right of the dotted line, the current account balance is greater than the fiscal balance, and the domestic private sector is running a financial surplus or net saving position.
This follows from the recognition that a current account surplus presents a net inflow to the domestic private sector (as export income for the domestic private sector exceeds their import spending), while a fiscal surplus presents a net outflow for the domestic private sector (as tax payments by the private sector exceed the government spending they receive).
Accordingly, the further we move up and to the left of the origin (toward the northwest corner of the map), the larger the deficit spending of households and firms as a share of GDP, and the faster the domestic private sector is either increasing its debt to income ratio, or reducing its net worth to income ratio (absent an asset bubble). Moving to the southeast corner from the origin takes us into larger domestic private surpluses.
The financial balance map forces us to recognize that changes in one sector’s financial balance cannot be viewed in isolation, as is the current fashion. If a nation wishes to run a persistent fiscal surplus and thereby pay down government debt, it needs to run an even larger trade surplus, or else the domestic private sector will be left stuck in a persistent deficit spending mode. source
We replace “- Fiscal Balance” with “+Public Sector Net Spending” or “+Public Deficit” and
“Private Sector Financial Balance with the equivalent “Private Sector Net Saving” we obtain the following
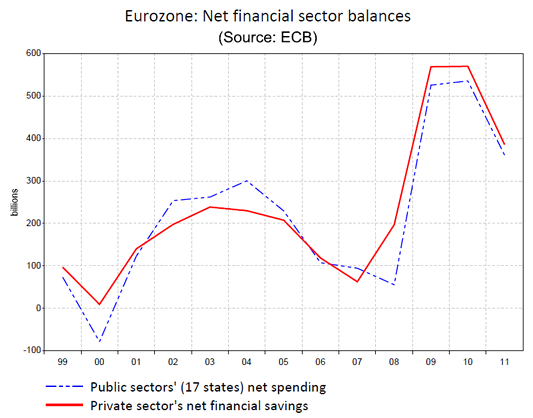
Private savings finance the public deficit and the current account surplus.
As you can see in the graph, the current account surplus is the difference between the red and the blue curve. During the crisis between 2007 and 2010, the European states tried to maintain growth with Keynesian measures. They increased the public debt, which was financed by a rise in private savings.
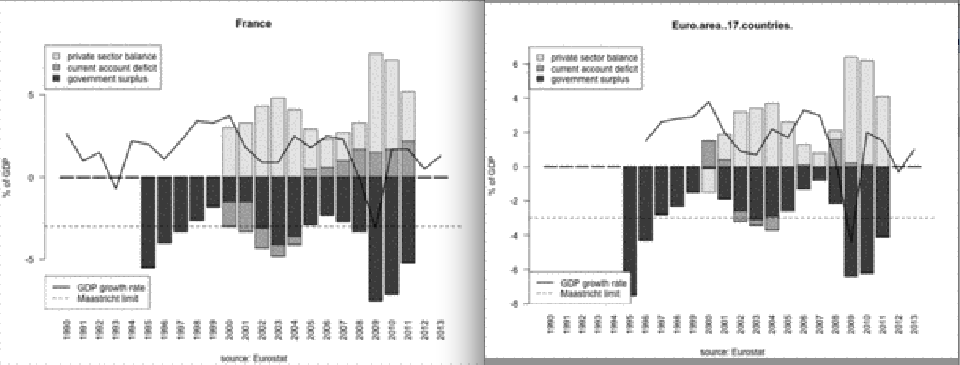
By 2010 the euro zone as a whole had a current account balance which was quite close to zero. The surplus of countries like Germany, the Netherlands and Finland is neutralized by France and the peripheral countries. France shows public deficits and current account deficits, hence the private sector is deficit spending.
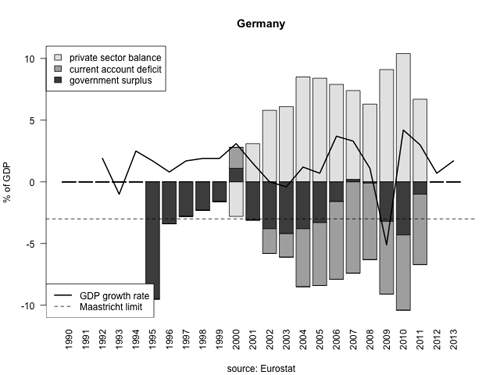
See in the following German case that the positive “private sector balance” column has the same height as the negative “government surplus and current account deficit” column.
As opposed to Germany, Japan currently exhibits huge public deficits, a relatively small current account surplus and a weak savings rate. Over the last twenty years, the Japanese public debt is mostly financed by Japanese private investors.
See more for


