The Asset Market Model implies that a currency will be in higher demand and should appreciate in value, if capital flows to the financial markets of that country increase. The Asset Market Model emphasizes financial assets.
Any capital inflow and outflow initiated by investors involves currency. For example, a hedge fund decided to sell the DAX and switched to SMI is effectively selling EUR/CHF. A second example is to sell to buy a property in London using the funds obtained via the sales of a house in Spain. This implies that EUR/GBP is sold.
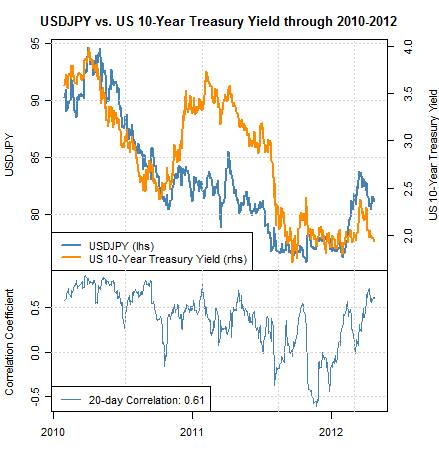
Another example is the correlation between Japanese government bond (JGB) yields and US treasuries and the Japanese yen. When government bonds rise in price (and inversely correlated yields fall), then the yen appreciates. Especially the huge number of Japanese private investors move out of riskier assets, e.g. American stocks, into safe bonds, consequently the yen gets stronger.
Another example is continuing immigration into Switzerland and Australia in recent years and resulting upwards pressure on real estate prices. Hard assets in these countries appreciate and therefore the currencies. Investors and trading algorithms often follow these immigration flows.
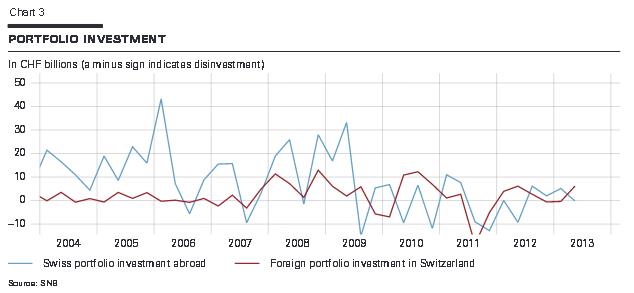
The Balance of Payments depicts both trade flows and capital flows. Trade flows are visible in the current account, capital flows are called “portfolio investments” inside the financial account.
The following example shows how until 2008, Swiss investors bought far more foreign assets than foreigners Swiss ones. With the foreign real estate boom, foreign yields on investment were higher than Swiss ones.The Swiss franc strongly depreciated. Since 2008, however, both positions are more or less equal. The franc appreciated again. In 2010 and since spring 2013 foreigners bought more Swiss securities than the opposite. Consequently CHF gained value again.
 In particular in 2012, capital flows into Switzerland managed to outpace by far the speculative positions of FX traders that were are all positioned long EUR/CHF or long USD/CHF (e.g. 30 K long USD/CHF contracts with 125000 CHF each in Oanda). The visible gap between the red and the blue line was up to 20 bln. CHF. Adding the current account surplus and some bank lending movements made it necessary that the SNB intervened with of 50 bln. CHF in May and June 2012.
The Asset Market Model and global stock markets
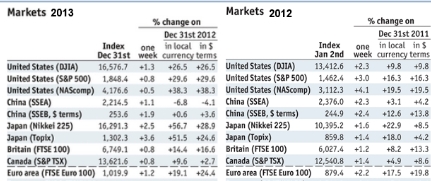
The evaluation of stock returns in US$ terms that regularly appears in “The Economist” reflects a different perspective on the Asset Market Model. In its extreme, this variant of the Asset Market Model suggests that stock returns calculated in the main investor currency US$ should be equal over the whole world.
Exceptions to the rule that all stock returns of developed nations should trade at the same US$ price, apply to countries with structural problems (like last year the European periphery) or the ones with high wages increases and reduced competitiveness (like this year in Emerging Markets).
One other example is the Japanese yen during the so-called “currency wars” or “Abenomics” . In 2012 the S&P500 yielded 16%, but the Nikkei 8.5% in US$ terms. For foreign investors a big part of huge Nikkei improvement was eaten up by the weaker currency.
This tendency continued in 2013: the yen further depreciated and the Nikkei appreciated but its dollar return remained relatively low. Still in the bull market of December 2013, the return of the Nikkei in US$ terms are still lower than what US Stocks yielded.
We judge that the big gap between return in the local currency and in US$ can not remain forever. A weaker currency and higher stock prices help to increase exports and employment. Consequently the GDP, income and asset prices further improve with the consequence that one day higher inflation shows up.
If despite inflation, growth continues, the central bank should hike interest rates and the currency must finally appreciate.
A quick introduction to the Asset Market Model is given here:
See more for


