Category Archive: 4.) Forex Live
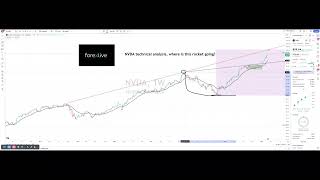
NVDA technical analysis, where is this rocket going? Watching 1050-1100
The most important to watch is Nasdaq futures but it there is no correction there yet, NVDA is eyeing 1000 round number and a bit higher, IMO, as shown in the NVDA technical analysis video. Go to www.ForexLive.com for additional views.
Read More »
Read More »
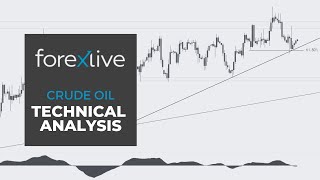
WTI Crude Oil Technical Analysis – All eyes on these key levels
#crudeoil #futures #technicalanalysis
In this video you will learn about the latest fundamental developments for WTI Crude Oil. You will also find technical analysis across different timeframes for a better overall outlook on the market.
----------------------------------------------------------------------
Topics covered in the video:
0:00 Fundamental Outlook.
0:57 Technical Analysis with Optimal Entries.
2:27 Upcoming Economic Data....
Read More »
Read More »
Buyers in the AUDUSD push the pair to swing level and MA resistance at 0.6524. Stay below.
The AUDUSD sellers have so far kept a lid on the pairs run higher. Staying below is more bearish.
Read More »
Read More »
EURUSD buyers making a break for it… Price moves above the 38.2% retracement
The 38.2% retracement of the move down from the December high comes in at 1.0864. Stay above is more bullish
Read More »
Read More »
USDCAD finds willing sellers versus the high from last week and backs off.
Although there are willing sellers against the eye from last week, the price remains above its 100-day moving average and 50% midpoint of the move down from the November 2023 high. Buyers and sellers battle it out.
Read More »
Read More »
Kickstart the FX day for March 5 with a technical look at the EURUSD, USDJPY and GBPUSD
The market is quiet to start the US session for March 5. What are the technical bias, the risk and the targets for the major currency pairs.
Read More »
Read More »
Stock market technical analysis update for 05 Feb, 2024
Check out https://www.forexlive.com/technical-analysis/stock-market-technical-analysis-es1-at-5140-watching-5170-and-then-watch-out-20240304/
Read More »
Read More »
USDJPY Technical Analysis
#usdjpy #forex #technicalanalysis
In this video you will learn about the latest fundamental developments for the USDJPY pair. You will also find technical analysis across different timeframes for a better overall outlook on the market.
----------------------------------------------------------------------
Topics covered in the video:
0:00 Fundamental Outlook.
1:20 Technical Analysis with Optimal Entries.
2:56 Upcoming Economic Data....
Read More »
Read More »
EURUSD trades up to the 38.2%, and finds sellers
The buyers Iin the EURUSD are making a play but can they get the price above the 38.2% and stay above?
Read More »
Read More »
USDCAD stays above the 100 day MA at 1.3544. Stay above is more bullish this week
The 100-day MA and the 50% of move down from the November high is the barometer for the buyers and sellers this week.
Read More »
Read More »
USDCHF reverses higher despite higher Swiss CPI data today. What next technically?
The USDCHF is back above the 200-day MA at 0.88354. That level will be the short term barometer for buyers and sellers. Staying above is more bullish.
Read More »
Read More »
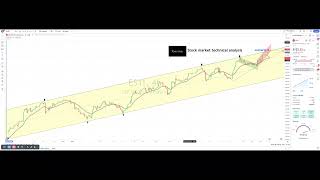
Stock market technical analysis, ES1 at 5140 ▲ watching 5170 and then watch out
?? S&P 500 Futures technical analysis and leading scenario, my opinion of area 5170... And then watch out for bears ???
See the video with the latest technical analysis of the S&P 500 futures, right here on ForexLive.com In this analysis, we view the market from the December contract to March, uncovering a simple channel and price movements and what they could mean for traders. ? Key Highlights of the stock maket technical analysis as...
Read More »
Read More »
Gold Technical Analysis – The price is at a key resistance zone
#gold #xauusd #technicalanalysis
In this video you will learn about the latest fundamental developments for Gold. You will also find technical analysis across different timeframes for a better overall outlook on the market.
----------------------------------------------------------------------
Topics covered in the video:
0:00 Fundamental Outlook.
0:42 Technical Analysis with Optimal Entries.
2:09 Upcoming Economic Data....
Read More »
Read More »
EURUSD Technical Analysis – The price is at a key support zone
#eurusd #forex #technicalanalysis
In this video you will learn about the latest fundamental developments for the EURUSD pair. You will also find technical analysis across different timeframes for a better overall outlook on the market.
----------------------------------------------------------------------
Topics covered in the video:
0:00 Fundamental Outlook.
1:11 Technical Analysis with Optimal Entries.
2:24 Upcoming Economic Data....
Read More »
Read More »


