


Full bio
[clear]
In the second quarter of 2016, the current account surplus amounted to CHF 17 billion. This was CHF 3 billion less than in the year-back quarter, mainly due to a decline in the receipts surplus in primary income (labour and investment income). The receipts surplus in primary income was CHF 1 billion, compared to CHF 7 billion in the year-back quarter. By contrast, the second-quarter surplus of receipts from trade in goods and services increased year-on -year by CHF 17 billion to almost CHF 20 billion.
[br]
In the quarter under review, the financial account recorded a net acquisition on both the assets and liabilities sides. On the assets side, the net acquisition amounted to CHF 29 billion (Q2 2015: CHF 40 billion), which was primarily made up of reserve assets and other investment. On the liabilities side, the net acquisition totalled CHF 24 billion (Q2 2015: CHF 11 billion), due mainly to other investment. In total, the financial account showed a balance of CHF 5 billion, or CHF 6 billion with the inclusion of derivatives.
In the international investment position, stocks of foreign assets increased by CHF 71 billion to CHF 4,298 billion in the second quarter of 2016. The increase was attributable both to transactions reported in the financial account and to capital gains resulting from stock exchange and exchange rate movements. Stocks of foreign liabilities also rose, by CHF 33 billion to CHF 3,541 billion, mainly due to transactions reported in the financial account. The net international investment position advanced by CHF 37 billion to CHF 757 billion.
The balance of payments (current account and financial account) covers Switzerland’s cross-border transactions with other countries over a given period. The international investment position indicates the stocks of Switzerland’s foreign financial assets (claims) and liabilities abroad at the end of this period. Transactions recorded in the financial account are the first factor which leads to changes in assets and liabilities in the international investment position. The second factor which has an impact on capital stocks is capital gains and losses resulting from stock market and exchange rate movements, as well as other changes in stocks.
In the comments on the balance of payments, period-by-period comparisons of transactions refer to the year-back quarter, since certain positions are influenced by seasonal factors (e.g. tourism), especially in the current account. Seasonally adjusted data are not available. By contrast, the period-by-period comparisons in the international investment position refer to stocks at the end of the previous quarter. The focus in this case is on changes in stocks over the course of the period under review.
For comprehensive tables covering the balance of payments and the international investment position, cf. the SNB’s data portal, data.snb.ch, Table selection, International economic affairs.
Overview
In the second quarter of 2016, the current account surplus amounted to CHF 17 billion. This was CHF 3 billion less than in the year-back quarter, mainly due to a decline in the receipts surplus in primary income (labour and investment income). The receipts surplus in primary income was CHF 1 billion, compared to CHF 7 billion in the year-back quarter. By contrast, the second-quarter surplus of receipts from trade in goods and services increased year-on -year by CHF 17 billion to almost CHF 20 billion.
[br]
In the quarter under review, the financial account recorded a net acquisition on both the assets and liabilities sides. On the assets side, the net acquisition amounted to CHF 29 billion (Q2 2015: CHF 40 billion), which was primarily made up of reserve assets and other investment. On the liabilities side, the net acquisition totalled CHF 24 billion (Q2 2015: CHF 11 billion), due mainly to other investment. In total, the financial account showed a balance of CHF 5 billion, or CHF 6 billion with the inclusion of derivatives.
In the international investment position, stocks of foreign assets increased by CHF 71 billion to CHF 4,298 billion in the second quarter of 2016. The increase was attributable both to transactions reported in the financial account and to capital gains resulting from stock exchange and exchange rate movements. Stocks of foreign liabilities also rose, by CHF 33 billion to CHF 3,541 billion, mainly due to transactions reported in the financial account. The net international investment position advanced by CHF 37 billion to CHF 757 billion.
Current accountReceiptsAccording to foreign trade statistics (total 1), second-quarter goods exports increased year-on-year by CHF 4 billion to CHF 54 billion. Exports in the chemical and pharmaceutical industry, in particular, were up, while exports in the watch industry receded. Receipts from non-monetary gold trading recorded a strong increase and came to CHF 19 billion, compared to CHF 13 billion in the year-back quarter. Net merchanting receipts declined by CHF 1 billion to CHF 6 billion. Overall (i.e. including merchanting and gold trading), receipts from goods trade amounted to CHF 79 billion, CHF billion higher than in the year-back quarter. Receipts from trade in services with foreign countries in the second quarter amounted to CHF 27 billion, up CHF 1 billion over the year-back figure. An increase was registered in insurance and pension services and business services, whereas receipts from financial services and transport services declined. As a result of lower income from investment abroad (particularly direct investment), primary income (labour and investment income) declined by CHF 7 billion to CHF 28 billion. Secon dary income (current transfers) advanced by CHF 1 billion to CHF 10 billion over the second quarter of 2015. ExpensesGoods imports according to foreign trade statistics (total 1) totalled CHF 44 billion, a CHF 4 billion increase over the year-back quarter. Almost all categories of goods registered higher imports in money terms, with chemical and pharmaceutical products recording a particularly strong rise. The only categories of imports which receded were jewellery and energy sources. As on the receipts side, expenses also saw substantial increases in non-monetary gold trading, amounting to CHF 18 billion compared to CHF 14 billion in the year-back quarter. Expenses for goods imports totalled CHF 64 billion, an advance of CHF 8 billion. Expenses in services imports, at CHF 22 billion, were at the same level as in the year-back quarter. Increases in expenses in telecommunications, computer and information services were offset by decreases in transport services and licence fees. Expenses in primary income (labour and investment income) decreased by CHF 2 billion to CHF 27 billion. This was due to lower income from direct investment, notably in the finance and holding companies category. With regard to secondary income (current transfers), expenses totalled CHF 14 billion, a CHF 1 billion increase over the year-back quarter. NetThe current account surplus amounted to CHF 17 billion, CHF 3 billion less than in the second quarter of 2015. Although the receipts surplus increased in both trade in goods and trade in services, it declined in primary income (labour and investment income). The expenses surplus in secondary income (current transfers) was lower than in the year-back quarter. | [caption id="attachment_70145" align="alignnone" width="594"] 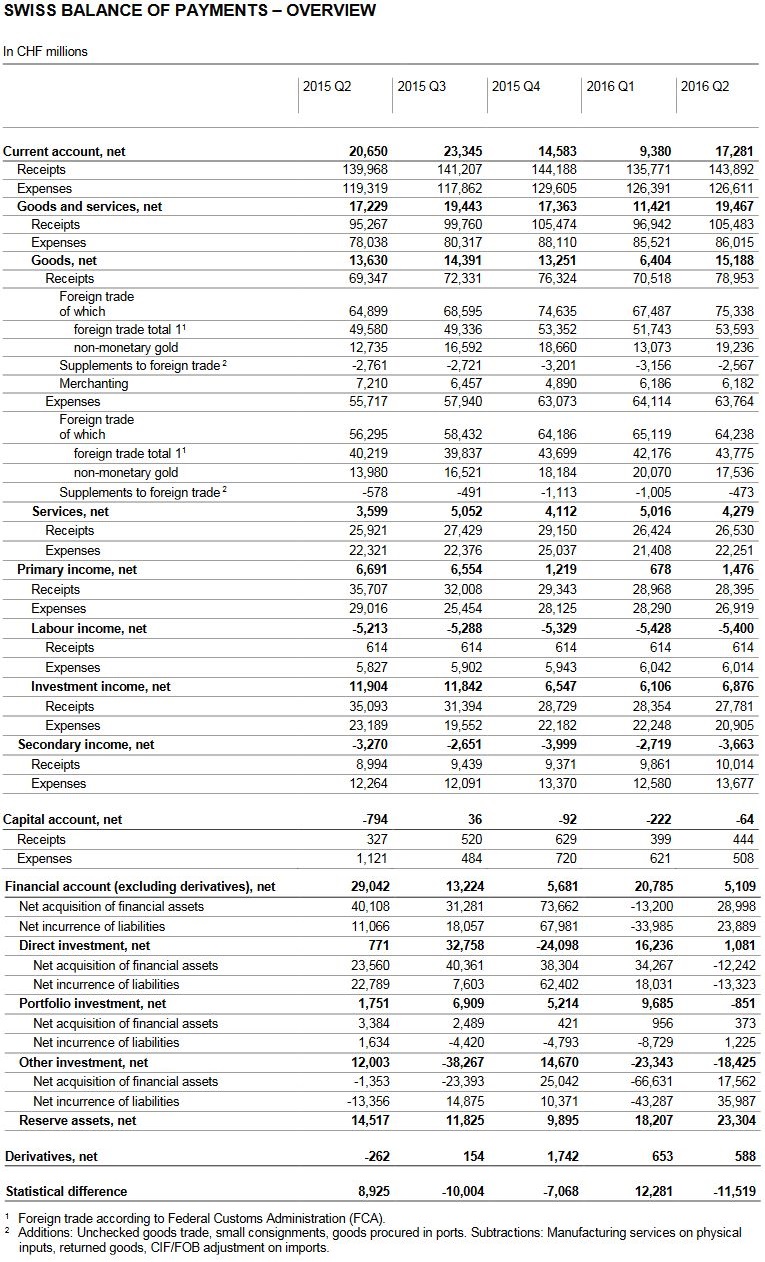 Swiss Balance of Payments - Overview - click to enlarge.[/caption] Swiss Balance of Payments - Overview - click to enlarge.[/caption] |
Financial accountNet acquisition of financial assetsNet acquisition of financial assets amounted to CHF 29 billion (Q2 2015: CHF 40 billion). This was mainly due to reserve assets and other investment. The former recorded a net acquisition of CHF 23 billion (Q2 2015: CHF 15 billion), due to foreign currency purchases by the SNB. Other investment registered a net acquisition of CHF 18 billion (Q2 2015: net reduction of CHF 1 billion), which was attributable to the fact that domestic banks increased their claims against banks and customers abroad. By contrast, direct investment recorded a net reduction of CHF 12 billion (Q2 2015: net acquisition of CHF 24 billion) due to domestic parent companies reducing their loans to subsidiaries abroad. In the case of portfolio investment, net purchases were on a par with net sales. Net incurrence of liabilitiesThe liabilities side of the financial account registered a net incurrence, namely of CHF 24 billion (Q2 2015: CHF billion). This was mainly determined by transactions in other investment, which amounted to CHF 36 billion (Q2 net reduction of CHF 13 billion), attributable mostly to domestic banks increasing their liabilities in business with banks abroad. Portfolio investment recorded a net incurrence of CHF 1 billion (Q2 CHF 2 billion). While investors abroad sold Swiss-issued debt securities, they also purchased shares in Swiss companies. As on the assets side, direct investment registered a net reduction, amounting to CHF 13 billion (Q2 2015: net incurrence of CHF 23 billion). This was primarily due to domestic parent companies reducing loans which they had received from their subsidiaries abroad. NetThe financial account balance amounted to CHF 6 billion (Q2 2015: CHF 29 billion). This is calculated as the sum of all net acquisitions of assets minus the sum of all net incurrences of liabilities plus the balance from derivatives transactions. This positive financial account balance corresponds to the increase in the net international investment position resulting from cross-bor der investment. | [caption id="attachment_70159" align="alignleft" width="596"] 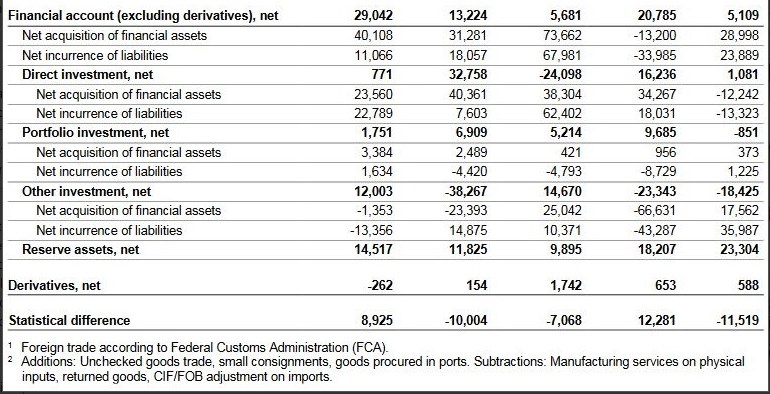 Extract from the Balance of Payments Q2 2016[/caption] Extract from the Balance of Payments Q2 2016[/caption] |
Switzerland’s international investment positionForeign assetsStocks of foreign assets were up CHF 71 billion on the previous quarter to CHF 4,298 billion. The increase was attributable both to transactions reported in the financial account as well as to capital gains resulting from stock market and exchange rate movements. The strongest increase was recorded in reserve assets, by CHF 35 billion to CHF 658 billion, mainly as aresult of transactions. Stocks of portfolio investment rose by CHF 24 billion to CHF 1,235 billion on the back of stock market and exchange rate gains. Other investment advanced by CHF 21 billion to CHF 771 billion, mainly due to commercial banks’ transactions in interbank and customer business. Stocks of derivatives increased by CHF 3 billion to CHF 123 billion. By contrast, stocks of direct investment declined by CHF 12 billion to CHF 1,510 billion, which was mainly attributable to transactions. Foreign liabilitiesStocks of foreign liabilities rose by CHF 33 billion to CHF 3,541 compared to the previous quarter. The largest increase was in stocks of other investment, by CHF 43 billion to CHF 1,129 billion, due to commercial banks’ t ransactions with banks abroad. Stocks of derivatives were up CHF 3 billion to CHF 119 billion. By contrast, direct investment receded by CHF 12 billion to CHF 1,262 billion, as a result of transactions. Stocks of portfolio investment receded by CHF 1 billion to CHF 1,031 billion. Net international investment positionThe net international investment position increased by CHF 37 billion over the last quarter to CHF 757 billion, since foreign assets advanced more strongly than foreign liabilities. | [caption id="attachment_70146" align="alignnone" width="599"] 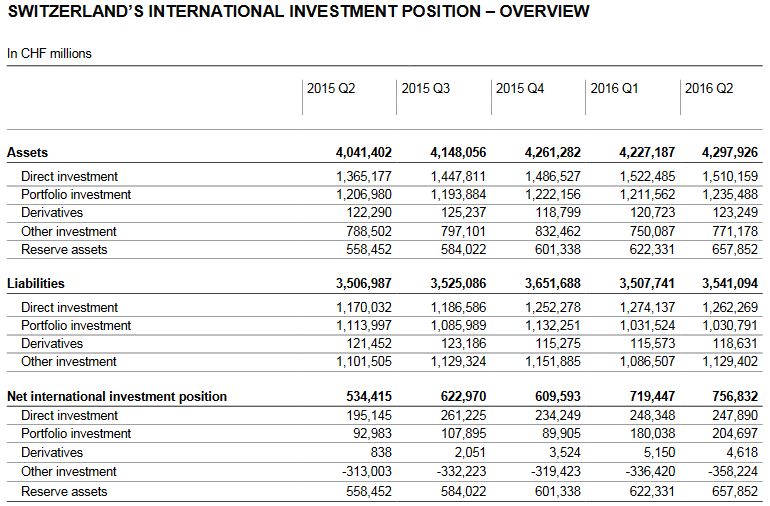 Switzerland's International Investment Position - Overview - click to enlarge.[/caption] Switzerland's International Investment Position - Overview - click to enlarge.[/caption] |
Remarks
The balance of payments (current account and financial account) covers Switzerland’s cross-border transactions with other countries over a given period. The international investment position indicates the stocks of Switzerland’s foreign financial assets (claims) and liabilities abroad at the end of this period. Transactions recorded in the financial account are the first factor which leads to changes in assets and liabilities in the international investment position. The second factor which has an impact on capital stocks is capital gains and losses resulting from stock market and exchange rate movements, as well as other changes in stocks.
In the comments on the balance of payments, period-by-period comparisons of transactions refer to the year-back quarter, since certain positions are influenced by seasonal factors (e.g. tourism), especially in the current account. Seasonally adjusted data are not available. By contrast, the period-by-period comparisons in the international investment position refer to stocks at the end of the previous quarter. The focus in this case is on changes in stocks over the course of the period under review.
For comprehensive tables covering the balance of payments and the international investment position, cf. the SNB’s data portal, data.snb.ch, Table selection, International economic affairs.
 On Swiss National Bank
-

SNB Sight Deposits: decreased by 2.2 billion francs compared to the previous week
-

Household wealth in 2025
-
Heads up for NZD and CHF traders, RBNZ Gov Breman and SNB Chair Schlegel to speak
-
Swiss franc appreciation has led to tighter monetary conditions – SNB minutes
-
SNB’s Chairman Schlegel: A few months of negative inflation wouldn’t be a problem
Main SNB Background Info

Featured and recent
-
 SNB Sight Deposits: decreased by 2.2 billion francs compared to the previous week
 -
 Corrections vs. Bear Markets: Why 20% Declines Are Obsolete
 -
 -40 Kilo! Ricarda Lang feiert Abnehmerfolg! Das Internet feiert!
 -
 Steuerrecht digitalisieren mit KI – eine gute Idee?
 -
 Why Switzerland is launching a charm offensive in Southeast Asia
 -
 Ex-Raiffeisen bank CEO fined for tax evasion
 -
 The price of gold matters, but availability matters more.
 -
 FATAL: EU Chefdiplomatin blamiert ganz Europa! China außer sich!
 -
 India’s situation shows why physical gold is different from paper exposure.
 -
 ZUGRIFF auf dein Vermögen: So schützen sich INSIDER