| The bid for “decoupling” has never been stronger, and, unfortunately, this time actually represents the weakest case yet for it. According to the mainstream interpretations of the most recent sentiment indicators, the US and European economies appear to be going in the complete opposite directions.
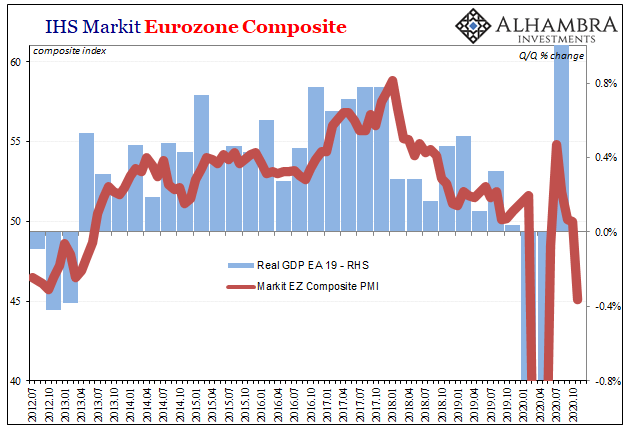
Beset by even more overreactive governments, spurred oppressively forward by an increase in COVID testing, in Europe the second wave of artificial restrictiveness has already arrived sending that system spiraling back into nearly certain re-recession. IHS Markit’s Eurozone PMI indices were appallingly bad in their “flash” assessments of so far in November 2020. The manufacturing sector held up somewhat better, though dropping three points to 55.4 from 58.4 in October. Services, however, were pummeled by arbitrary interventions (and ongoing weakness); that particular PMI collapsed to just 41.3, down from 46.9 last month. |
IHS Markit Eurozone Composit, 2012-2020 |
| Combined, the Eurozone Composite came in an icy 45.1, the first not only below 50 since earlier in the year, way below 50. Uh oh:
Over here in the United States, outwardly the attitude is very different. Who cares about Europe’s retrenchment, they say, in America the economy and its suddenly very important manufacturing sector has rarely been better! A manufacturing recession, as has appeared from time to time over the last dozen years, these on the downside get written off as nothing more than the curiosities of a small slice of the overall economy. Given the numbers provided by Markit for November 2020 (like those published by the ISM for October), my how quick the manufacturing gets treated as the “real” picture of what must be going on. It’s nothing like Europe. |
IHS Markit Composit PMIs, 2017-2020 |
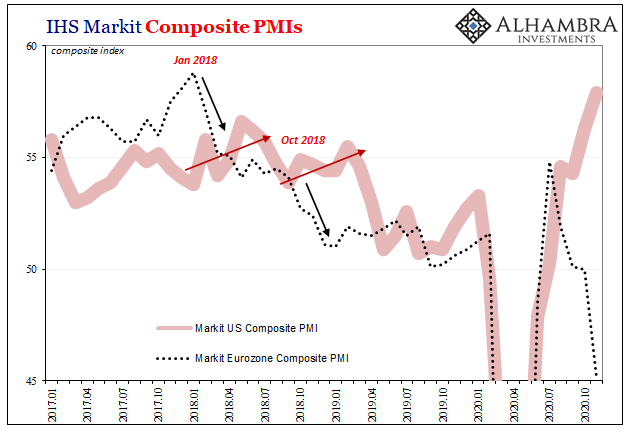
| The flash figures for the US economy from Markit are definitely heading in the opposite direction, pushing up to what appears to be an extreme divergence:
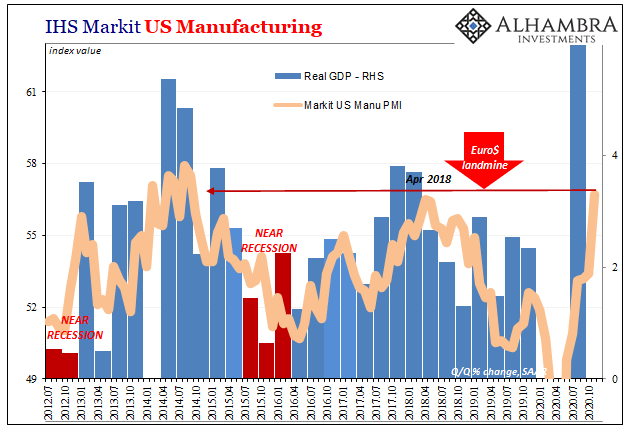
Markit’s picture of US manufacturing hasn’t been this solid in an impressive-sounding 74 months; at 56.7 in November, that’s the highest since (revised) September 2014. The service sector number was nearly as good, at 57.7 the best since March 2015. Combined, the composite index scored 57.9 (somehow greater than both manufacturing and services), equaling its highest month also since March 2015. Reports of the “V’s” demise greatly exaggerated, at least in America? Decoupling finally scores its first victory after nearly thirteen years of trying? |
IHS Markit US Manucaftirong, 2012-2020 |
| Reading these PMI figures appropriately, however, you realize that there isn’t actually much difference in them between the US and Europe once you normalize to the situation which actually exists in 2020. The economy this year is nothing like what it had been in 2015 or 2014; and let’s not forget, those years were not particularly great years for the economy in any other place than media stories.
This is why we’ve termed the trend since June a summer “slowdown” rather than downturn or recession; those latter two will be applied to Europe. The US sentiment figures are, believe it or not, consistent with that slowdown – not so different than Europe. The US economy, maybe unlike its European economy right now, continues to rebound. What’s at issue is just how strongly this might be happening. A high 50s in any PMI sounds unassailably terrific; and it could be terrific if you see high 50s show up and stay up in a sentiment survey surveying conditions in an otherwise normal and legitimately booming economy. An economy instead experiencing suspiciously low levels of growth, like since 2007, well, high 50s does not mean the same thing at all. |
Industrial Production, SA 1991-2017 |
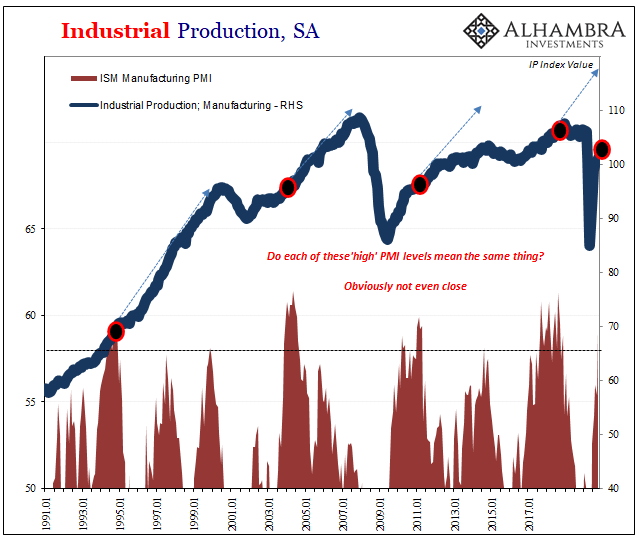
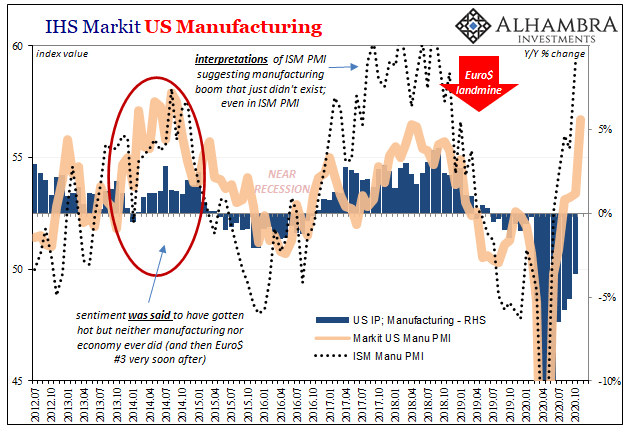
| In that second case, like in both 2014 and 2017, high 50s simple means(t) the system is moving forward. That’s it. In other words, all it would really indicate is an absence of further contraction (like 2012, 2015-16, and 2018-19) which isn’t at all the same thing as accelerating into full recovery.
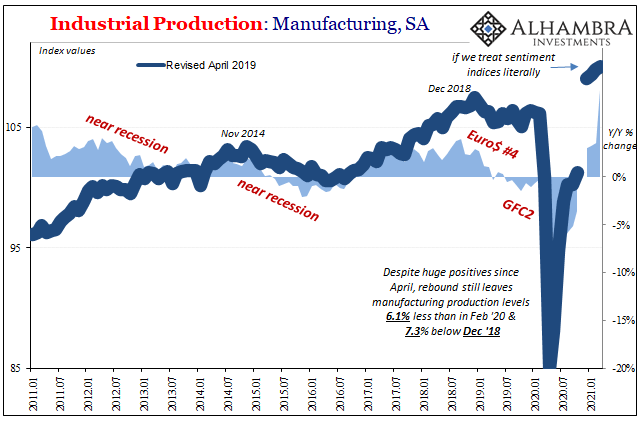
You can see exactly what I mean below: Though the ISM’s index reached 60 (or close to it) in each of those marked periods above, they weren’t the same 60 each time; especially the last one. Manufacturing output in the US during 2017 was still substantially less than it had been at 2007-08 peak, and not even that much more than it had been in 2004! Instead, high 50s or better in 2017 merely demonstrated how at most there was a good chance the economy was moving forward and not falling backward – at that moment. Even in the high 50s/low 60s, there wasn’t much or any acceleration. Same PMI numbers, very different interpretations. |
Industrial Production: Manufactirings, SA 2011-2021 |
| More to the point, that lack of meaningful acceleration given woefully inadequate baseline conditions despite a wildly optimistic mainstream interpretations of the ISM’s high 50s/low 60s would ultimate lead to the same kind of divergence and resurgence in claims of decoupling. In 2018, Europe and the US didn’t end up going in different ways, they would end up moving the same way (downturn) just at different times.
If the economy was actually set to accelerate meaningfully, meaning to pull out of its longer run rut and ramp up into a legitimate recovery, we’d have seen PMI’s jump from the high 50s to the high 60s and probably better than that. Only the ISM’s index accomplished halfway to that level. Even that was an isolated case corroborated only by a few other data points (like the faulty unemployment rate). Some things never change. If we were to take these PMI estimates at face value, looking at them as indications of absolute levels rather than attempted guess related to relative changes, the US manufacturing sector in the months ahead would have to look like what you see above. That’s not even remotely indicated by anything – including these PMI numbers where they are now. Even in the upper half of the 50s, they are simply way, way too low for the established conditions of 2020. You can see what I mean in the US IP estimates for manufacturing. Therefore, all they mean is that the US economy seems to be rebounding at a relatively low rate; which, following a big downturn, leads to an entirely different set of circumstances. |
IHS Markit US Manufacturing, 2012-2020 |
The US isn’t booming in a way Europe is not, rather Europe is falling apart already in a way that the US still could.
Where are the high 60s? Where are the 70s? Markit’s US PMI’s have inched closer to the low 60s, but that doesn’t even mean what little it had in 2017 and 2014. Things have changed, for the worse, and the worse things have gotten the higher PMI’s have to rise in order to indicate whichever economy is meaningfully improving.
In a lot of recent historical cases, rising PMI’s are pretty much all there is. Given that they indicate relative rather than absolute changes, no wonder there is so much confusion about what they mean (and that, apparently, includes Economists working for the companies that produce them). Even if the ISM’s numbers in 2017 had meant what everyone had said they meant, they were still nowhere near enough to keep 2018 from becoming 2019.
That was because in 2017 they hadn’t meant that at all. And now in 2020, we wish it was still 2017.
Full story here Are you the author? Previous post See more for Next postTags:


