


George Dorgan
My articles My siteAbout meMy videosMy books
Follow on:LinkedINTwitterSeeking Alpha
CFA SocietyEconomicBlogs
The Q1/2016 update on the SNB investment strategy and its assets.
The Swiss National Bank is a passive conservative investor. As opposed to other investors, the exposure in currencies is as important as the strategic asset allocation according asset classes (bonds, equities, cash, real estate). The importance of currencies is one reason why the SNB is often called a hedge fund, the second the volatility of gains and losses.
In this post we will concentrate on the assets side, investment strategy and composition of “FX reserves”.
SNB Portfolio by Asset ClassThe SNB possesses 60% of government bonds. In her report, the SNB add cash-like instruments
|
 Source 2015 Annual Report and recent SNB data
|
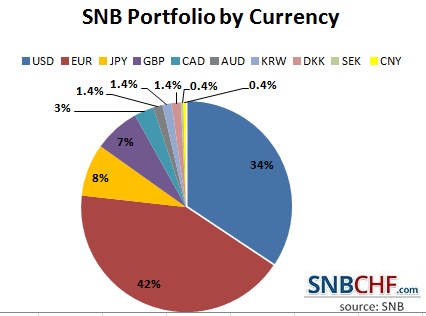
SNB Portfolio by Currency42%: EUR
|
 Source 2015 Annual Report and recent SNB data |
See the history of the balance sheet with focus on Owner’s Equity and on profit & loss. For a background of SNB liabilities and debt see here.
The SNB is a conservative investor: it invests mainly in bonds
Bonds: Mainly government bonds, in particular US treasuries and German government bonds. Those two make up around 50% of the portfolio.
Equities: The SNB is a passive investor
Equities: The SNB has currently an equities share of 20%.
She invests in single equities, that finally represent a broad index. Therefore she is a passive investor, she replicates indices – without buying index ETFs.
Since the dollar share is high, the share of S&P 500 is high. With 3.67% Apple (AAPL) is the biggest component of the S&P 500. And therefore, the SNB possesses a lot of Apple shares, what Bloomberg here details.
| Components of the S&P 500 | Symbol | % of S&P500 |
|---|---|---|
| Apple Inc. | AAPL | 3.67 |
| Microsoft Corporation | MSFT | 2.37 |
| Exxon Mobil Corporation Common | XOM | 1.85 |
| General Electric Company Common | GE | 1.54 |
| Johnson & Johnson Common Stock | JNJ | 1.53 |
As opposed to other investors, the exposure in currencies is as important as the strategic asset allocation according asset classes (bonds, equities, real estate). The importance of currencies is one reason why the SNB is often called a hedge fund, the second the volatility of gains and losses.
Assets Details
| Currency allocation (excl. swaps) |
Foreign Currency Investments | CHF Bond Investments | |||||||||
|---|---|---|---|---|---|---|---|---|---|---|---|
| 2016 | 2016 | 2015 | 2014 | ||||||||
| Q2 | Q1 | Q4 | Q3 | Q2 | Q1 | Q4 | Q3 | Q2 | Q1 | ||
| Total balance sheet in CHF (source) |
690 nb | 660 bn | 640 bn | 614 bn | 577 bn | 581 bn | 561 bn | 525 bn | 508 bn | 495 bn | |
| Gold | 6.2% | 6.1% | 5.5% | 5.9% | 6.3% | 6.6% | 7.1% | 7.5% | 7.7% | 7.7% | |
| Fiat Currency Investments, of which: |
635 bn | 595 bn | 593 bn | 566 bn | 530 bn | 531 bn | 510 nb | 471 bn | 457 bn | 447 bn | |
| CHF | – | – | – | – | – | – | – | – | 100% | ||
| USD | 34% | 33% | 32% | 33% | 32% | 32% | 29% | 29% | 27% | 27% | – |
| EUR | 41% | 42% | 42% | 42% | 42% | 42% | 46% | 45% | 46% | 48% | – |
| GBP | 7% | 7% | 7% | 7% | 7% | 7% | 6% | 7% | 7% | 7% | – |
| JPY | 8% | 7% | 8% | 8% | 8% | 8% | 8% | 9% | 9% | 8% | – |
| CAD | 3% | 3% | 3% | 3% | 4% | 4% | 4% | 4% | 4% | 4% | – |
| Other (1) | 7% | 8% | 7% | 7% | 7% | 7% | 7% | 6% | 7% | 6% | – |
| Investment categories | |||||||||||
| Investments with banks | 0% | 0% | 0% | 0% | 0% | 0% | 0% | 0% | 0% | 0% | – |
| Government bonds (2) | 69% | 68% | 71% | 71% | 72% | 71% | 73% | 73% | 73% | 76% | 40% |
| Other bonds (3) | 11% | 12% | 11% | 11% | 11% | 11% | 12% | 11% | 11% | 8% | 60% |
| Equities | 20% | 20% | 18% | 18% | 18% | 18% | 15% | 16% | 16% | 16% | – |
| Breakdown of fixed income assets (4) | |||||||||||
| AAA-rated | 59% | 59% | 61% | 60% | 62% | 63% | 63% | 63% | 65% | 70% | 74% |
| AA-rated | 25% | 26% | 24% | 25% | 24% | 24% | 22% | 29% | 27% | 24% | 25% |
| A-rated | 11% | 10% | 11% | 10% | 10% | 10% | 10% | 3% | 3% | 2% | 1% |
| Other | 5% | 5% | 4% | 5% | 4% | 5% | 5% | 5% | 5% | 4% | 0% |
| Bond duration (years) | 4.2 | 4.3 | 4.1 | 3.9 | 4.1 | 4.1 | 4.0 | 4.0 | 3.8 | 3.3 | 7.7 |
| Data Source via the Internet Archive | Q2/16 | Q1/16 | Q4/15 | Q3/15 | Q2/15 | Q1/15 | Q4/14 | Q3/14 | Q1/14 | ||
(1) Mainly AUD, DKK, KRW, SEK and SGD plus small holdings in additional currencies in the equity portfolios.
(2) Government bonds in their own currencies, deposits with central banks and BIS; in the case of CHF investments, also bonds issued by Swiss cantons and municipalities.
(3) Government bonds in foreign currency, covered bonds, bonds issued by foreign local authorities, supranational organisations, corporate bonds, etc.
(4) Average rating, calculated from the ratings of the three major credit rating agencies.Equities are managed on a purely passive basis, whereby broad market indices of advanced economies are replicated. Exchange rate and interest rate risks are managed using derivative instruments such as interest rate swaps, interest rate futures, forward foreign exchange transactions and foreign exchange options. In addition, futures on equity indices are used to manage the equity investments.
Source: This page at the SNB shows exactly how the currency reserves are invested.
The investment structure at the year-end is also published in the Annual Report under ‘Asset management’.
Heavy fluctuations in 2012
In 2012 there were heavy flucations. The SNB bought euros where they were cheap against the dollar, at around $1.25. In August/September 2011, however, they bought USD when the euro was over $1.40.

Breakdown by major asset classes
The following gives a rough estimate of major SNB positions (see the European ratings e.g. here), in comparison to all FX reserve positions (of which gold and the smaller IMF, SDR or repos positions are excluded).
- German and other AAA EUR government bonds make up around 22% of the FX reserves = 48% * 60% * 76%
Explanation: EUR share 48%, Government bonds 60%, German bonds remain the only major euro-denominated AAA bonds, AAA 76%
Other AAA are: Dutch, Austrian, Finnish and Luxemburg bonds, all of them smaller countries. - US treasuries are around 16% of the FX reserves = 27% * 60% * 100%
Explanation: USD share 27%, Government bonds 60%, only U.S. issues USD gov. bonds - French (and Belgium) government bonds make up around 5.2% of the FX reserves = 48% * 60% * 18%
Explanation: 48% EUR, Government bonds 60%, AA share 18%, France (and Belgium) are only AA in Europe. - Japanese JGB are around 5.4% = 9% * 60% * 100%
Explanation: JPY share 9%, government bonds 60%, only Japan issues gov. bonds in JPY - UK government bonds are around 4.2% of the FX reserves = 7% * 60% * 100%
Explanation: GBP share 7%, government bonds 60%, only UK issues gov. bonds in GDP - Canadian government bonds are around 2.4% of the FX reserves = 4% * 60% * 100%
Explanation: CAD share 4%, government bonds 60%, only Canada issues gov. bonds in GDP
SNB Investment Strategy 2007-2013
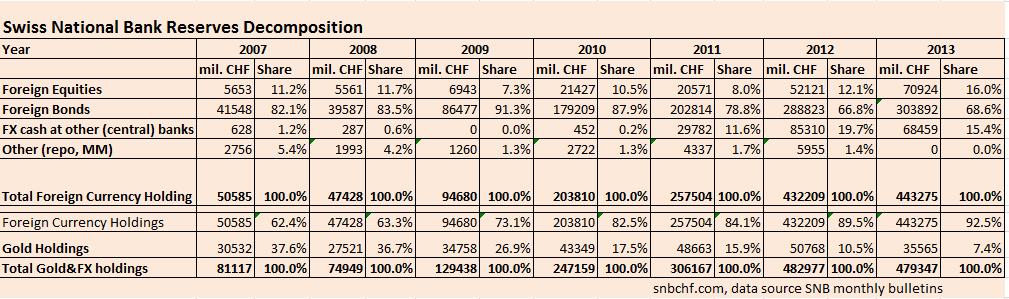
Historic data:
For comparison Q1/2014
| (source SNB here Internet Snapshot) |
Foreign currency investments
|
CHF bond investments
|
||
|---|---|---|---|---|
|
Currency allocation, excluding investments and liabilities from foreign exchange swaps
|
Q2/2014 | Q1/ | ||
|
CHF
|
–
|
–
|
100%
|
(100%)
|
|
USD
|
27%
|
(27%)
|
–
|
–
|
|
EUR
|
47%
|
(48%)
|
–
|
–
|
|
GBP
|
7%
|
(7%)
|
–
|
–
|
|
JPY
|
8%
|
(8%)
|
–
|
–
|
|
CAD
|
4%
|
(4%)
|
–
|
–
|
|
Other (1)
|
7%
|
(6%)
|
–
|
–
|
|
Investment categories
|
||||
|
Investments with banks
|
0%
|
(0%)
|
–
|
–
|
|
Government bonds (2)
|
74%
|
(76%)
|
37%
|
(37%)
|
|
Other bonds (3)
|
11%
|
(8%)
|
63%
|
(63%)
|
|
Equities
|
15%
|
(16%)
|
–
|
–
|
|
Breakdown of fixed income assets (4)
|
||||
|
AAA-rated
|
66%
|
(70%)
|
73%
|
(74%)
|
|
AA-rated
|
26%
|
(24%)
|
27%
|
(26%)
|
|
A-rated
|
3%
|
(2%)
|
0%
|
(0%)
|
|
Other
|
5%
|
(4%)
|
0%
|
(0%)
|
|
Investment duration (years)
|
3.7
|
(3.3)
|
6.7
|
(6.5)
|
Find here the information about
SNB Reserves Composition in Q2/2013,
here the one for Q1/2013 and 2012.
See the historical composition of SNB reserves until 2012 in this post.


3 comments
Julien
2016-02-29 at 12:18 (UTC 2) Link to this comment
As your graphs show here, from Q2 2012 to Q3 2012 the share of EUR reserves went from 60% to 48% and the share of USD reserves from 22 to 28%. If you look at quarterly data on 2012-2016 you also have sometimes this “strange phenomenon”, namely increases in USD total holdings and a decrase in EUR total holdings. I can’t get this.
The SNB has only been intervening in the EUR/CHF market since 2012, hasn’t it ? To my view it makes no sense for the SNB to buy dollars to prevent the CHF from appreciating towards the EUR. so at the end why didn’t the share of USD holdings decrase to very low level (since the total holdings increased and the USD holdings theoretically remained similar)…? I find it very counter-intuitive that it even increased. I guess valuation effects can’t be that high.
Thanks for your sharing your expertise here if you have any idea on this.
George Dorgan
2016-03-01 at 10:14 (UTC 2) Link to this comment
I wrote a post on that
https://snbchf.com/2012/11/snb-q3-results-2012
It was a good SNB bet to buy USD when EUR/USD was far over 1.30
Julien
2016-03-01 at 11:12 (UTC 2) Link to this comment
ok got it, the SNB sold EUR for USD when EUR/USD was high. Quite weird to my view though to see that the SNB “bet” as you said, I mean why not selling EUR for CHF then if as a public institution you can afford reducing your EUR portfolio (I read from you they did it from 2011Q4 to 2012Q1) instead of taking risks.