Read More »


 On Swiss National Bank
  Main SNB Background Info


 Waffenstillstand im Nahen Osten: Geht die Börsenparty jetzt weiter?
10 Apr 2026
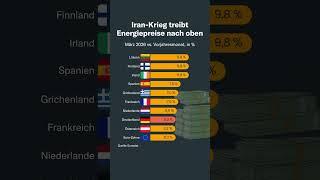 Iran-Krieg treibt Preise nach oben
10 Apr 2026
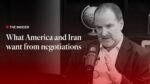
 What America and Iran want from negotiations | The Economist
10 Apr 2026
 USDCHF moves stretching away from the 100 day MA. Trades to new lows for the week.
10 Apr 2026
 The markets – including the USD – are little changed to kickstart the Friday trading
10 Apr 2026
 Telekom: Rekorddividende vs. Preiskampf – Das wahre Fazit für Investoren
10 Apr 2026
 Merz erlebt außenpolitischen Supergau! Deutschland isoliert!
10 Apr 2026
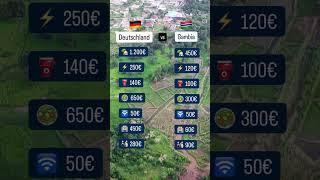 Deutschland vs. Gambia #thorstenwittmann #finanzstrategien #geldpolitik #gambia #deutschland
10 Apr 2026
 Are Trump supporters waking up the risks?
10 Apr 2026
 EIL: Musterklage wegen GEZ: Bald Millionen Haushalte befreit?!
10 Apr 2026
 So schütze ich mein Vermögen vor ENTEIGNUNG und staatlichem Zugriff! 3 Tipps
10 Apr 2026
 Wie lange dauert es, bis Du die Million knackst?
10 Apr 2026
 Krankenkassen-Reform: Das steckt drin
10 Apr 2026
 Why is Israel jeopardising the ceasefire? | The Economist
10 Apr 2026
 Money As We Know It Is In Trouble
9 Apr 2026
 EIL: Politbombe in New York! Mamdani will Weiße stärker besteuern als Schwarze!
9 Apr 2026
 Kommunismus zerstört die Umwelt!
9 Apr 2026
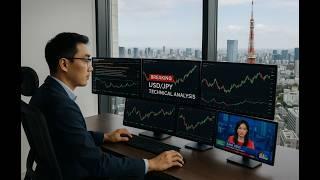 USDJPY trades to new highs and tests the converged 100/200 hour MAs
9 Apr 2026
 NZDUSD stretches back higher but running into MA resistance
9 Apr 2026
 Entleisung bei Hayali: “Bürger sollen bei 50 Euro mehr für Sprit nicht gleich nach dem Staat rufen!”
9 Apr 2026