Jeffrey P. Snider
My articles My offerMy siteAbout meMy videosMy books
Follow on:LinkedINTwitterSeeking Alpha
It should be as simple as it sounds. Lower LT UST yields, less growth and inflation. Thus, higher LT UST yields, more growth and inflation. Right? If nominal levels are all there is to it, then simplicity rules the interpretation.
Visiting with George Gammon last week, he confessed to committing this sin of omission. Rates have gone up, he reasoned reasonably, therefore it would seem to follow how the market must be shifting expectations toward the more optimistic and favorable economic case.
To some, perhaps many, they’ve taken their interpretation of same a step (or twelve) further by claiming the bond market is in the process of a radical change in outlook, finally surrendering to the Great Inflation 2.0 after having been stupidly bearish on prices and macro for almost the entire span of last year.
| But the yield curve is not now, nor has it ever been, so simple.
There are, in actuality, three variables to always keep in mind whenever interpreting. The first, which we won’t delve much into today, is the relative nominal level. Even if everything is going right and the other two factors moving favorably, should the entire curve stay historically low that’s already a red flag. What follows is the second element, that which was proposed at the outset: the relative direction of any changes in yields. Third, to me the more if not most important is the curve’s shape. Steep or flat, how LT rates are behaving in the context of ST yields and rates. So, it’s not as simple as: down = bad, good = up; though you can easily understand why that impression lingers in the public consciousness. If, on the contrary: 1. Rates overall stay low; 2. Even as LT yields may rise; 3. Should those LT rates be rising because of those in the ST; then that’s not the same at all. Breaking down yields is a pretty simple process, too. We start with easy Fisherian decomposition which you can put in some kind of fancy econometric format if you desire. For our purposes here, there’s no need since we can effortlessly just eyeball the thing. |
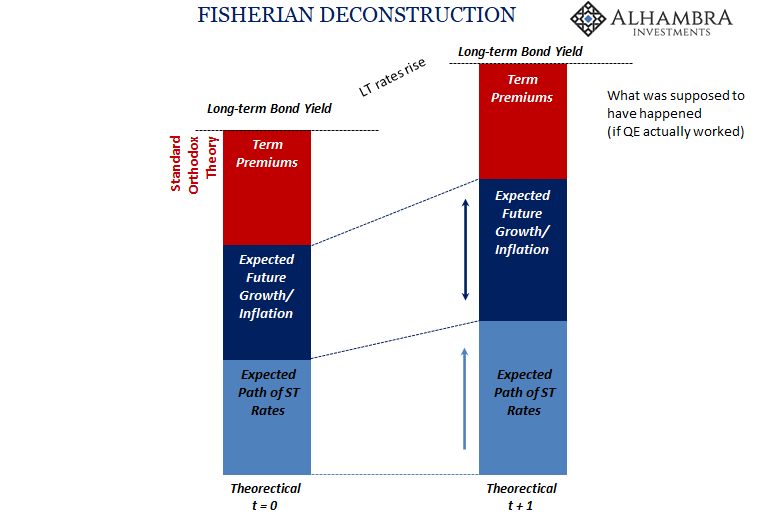 . |
Unlike standard orthodox theory, we’ve no need for term premiums because, well:
You can read the explanation why at the link above. This leaves us with just two basic pieces: the expected path of ST rates and then what Irving Fisher realized more than a century ago, forward longer run expectations about growth/inflation. The LT yield is some mixed up combination of those two. |
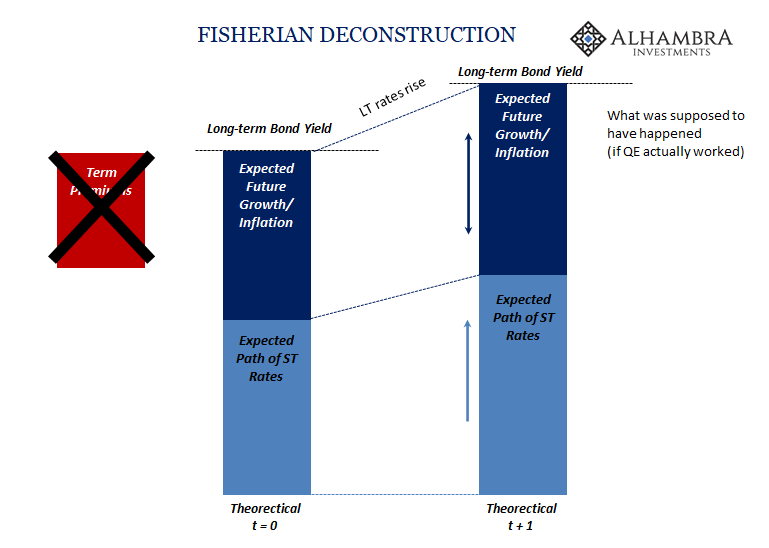 . |
| The long-sought transition to global normalcy – from money to finance to real economy – should have looked like, in the bond market, what you see above. The expected path of ST rates contributes more to LT yields as does the commiserate improvement about perceived growth and inflation prospects; the two actually reinforcing one another (assuming, of course, the Fed is right about why it’s influencing ST rates).
From ultra-low LT yields post-2008, these were supposed to move closer to what they used to be. They never once did for equally obvious reasons; the economic prospects for growth and inflation never materially improved despite anything the Fed did to the contrary (especially 2017-18). But what about 2020 and now after? What you easily find is how the initial reflationary period (defined loosely here as dating from the August 2020 lows through the first BOND ROUT!!!! topped out in mid-March 2021) was absolutely consistent with the good pattern – if only in two out of the three dimensions. The expected path of ST rates was up if ever so slightly (represented by the 2-year UST yield which only ticked higher while the 5-year moved much farther) while growth and inflation expectations obviously then improved. The curve steepened and nominal rates across it were going higher. But the curve never traveled that far upward, meaning it didn’t actually break out in terms of our first criteria. Red flag. Topping out with the 10s at jut 1.74% wasn’t as much of a shift as it had been made out to be. |
 . |
| Even so, the fact that in early 2021 the curve was meeting the other two conditions was at least a modestly good sign; that the market was judging the future to be materially better than 2020 – low standard – if still a long ways from normal.
The argument, such that there may be any, is how the market has performed since that point. I think you can literally see why it isn’t or shouldn’t be much of one: At each respective top along the way, expectations for ST rates (confirmed by eurodollar futures) have moved up, though especially so going back to October. Because of this, it leaves expected growth and inflation to have shrunken materially since that mid-March inflection entirely consistent with the third criteria. Flat curves mean flat curves and unless they are flattening in accordance with at least Criteria #1 (because curves aren’t supposed to be steep, but they are supposed to go flat at a normal, healthy interest rate level far, far above what you see here) then essentially that’s the ballgame. The market is both rejecting taper and rate hikes and simultaneously, because of it, forming what’s very clearly shaping up as Conundrum No5. |
 . |
| There are any number of pretty obvious and damning pieces of evidence why this would be, and have been for nearly a year already, most of which we’ve documented over the traverse of these specific months in question – starting right from the beginning with Fedwire.
So, 2022 begins with modestly rising, suspiciously modest rising yields but flattening curve (not good) at still obscenely low nominal levels (more not good). The meaningful difference between rising yields late 2021/early 2022 is night and day from rising yields late 2020/early 2021: |
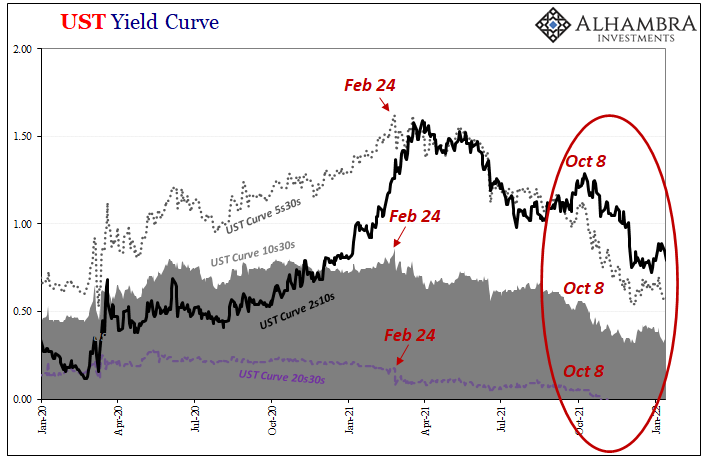 . |
The curve, as always, could change but why would it now? What has changed lately in any material fashion? According to the vastly more important shape, even as rates are pushed up from below there is no steepening in it anywhere. On the contrary, flatness is over the past week or so pushing new levels of flat.
And this is hardly the first time (see: 2018).
I’m obliged the usual disclaimer: this does not mean imminent recession or even necessarily recession at any point. That’s not what we’re really talking about here, not yet. All we can definitively conclude, for now, is that there is and has been no change in bond market perceptions about the balance of future probabilities that, with low nominal levels and an increasingly flat shape, are tilted decidedly toward the not-inflation and unfavorable for whatever the latter might end up.
Instead, the only thing which has changed between the early to middle part of last year and this year is the Fed. Again.
Full story here Are you the author?Tags: Bonds,currencies,Deflation,economy,Featured,Federal Reserve/Monetary Policy,Growth,inflation,Markets,newsletter,rate hikes,U.S. Treasuries,Yield Curve