Marc Chandler
My articles My offerMy siteAbout meMy videosMy books
Follow on:LinkedINTwitterSeeking AlphaAmazon
George Dorgan
My articles My siteAbout meMy videosMy books
Follow on:LinkedINTwitterSeeking Alpha
CFA SocietyEconomicBlogs
Swiss FrancDuring the day the EUR/CHF has fallen to a low of 1.0819. We know that the in-official new floor lies at that level. Moreover, the SNB had to polish the Q3 results. With interventions she lifted the EUR/CHF to 1.0893 and the euro continued rising thanks to speculators that jumped on the train. |
EUR/CHF, September 30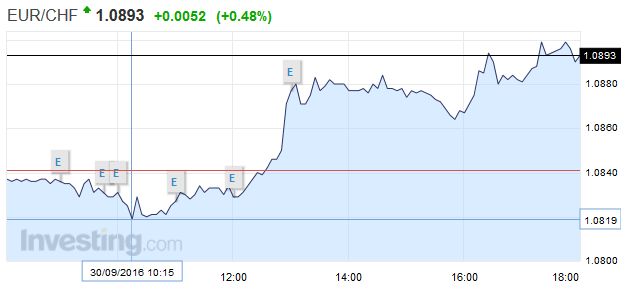 . |
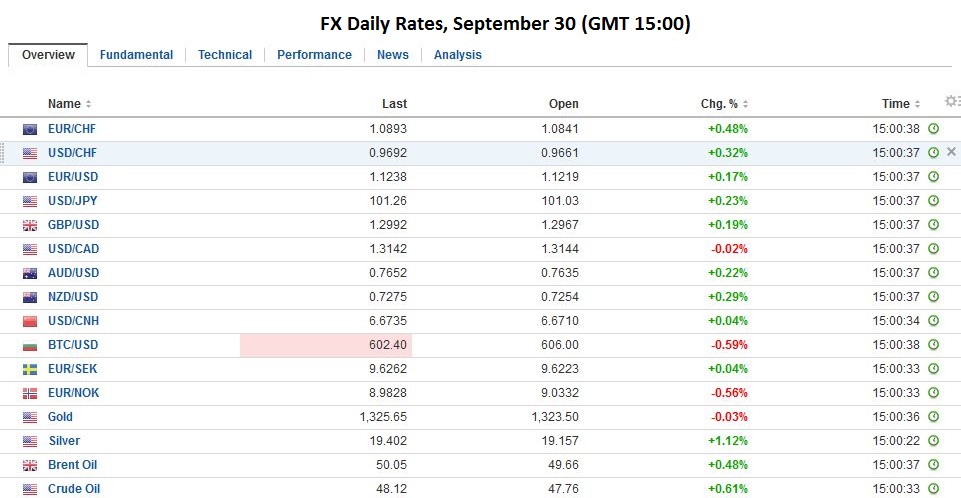
FX RatesTrue to its recent habit, the US dollar is finishing the week on a firm note. On the month, though, the greenback has fallen against most of the majors, but sterling, the Canadian dollar, and the Swedish krona. |
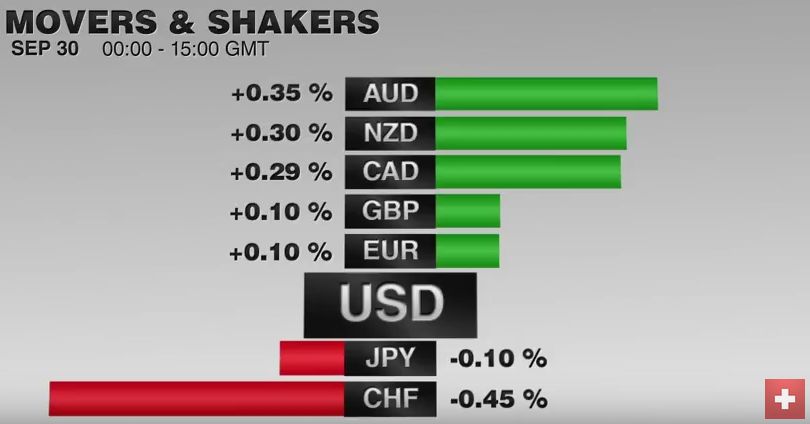 . - Click to enlarge |
| Global equities are trading heavily, and investors’ angst is lending support to bond markets. The concerns about the contagion effect emanating from Germany’s largest bank is taking a toll on sentiment. Deutsche Bank stock fell to a new record low in the European morning but has turned higher in subsequent turnover. Nevertheless, the financial sector is Europe is off twice what the loss of the overall market. The Dow Jones Stoxx 600 is off 1%, while the financial sector is off more than 2%. Italian banks share index is off 2.5% and is near two-month lows.
|
 . - Click to enlarge |
| In addition to the Chinese data, there are two other events this weekend to note. The first is a formality. The Chinese yuan will be included in the IMF’s SDR starting October 1. The second is more substantive. Hungary holds a referendum on the EU’s immigration policies. It is likely to reject plans to relocate refugees, setting the stage for an escalation of the simmering confrontation with the EU. |
 . - Click to enlarge |
ChinaThe MSCI Asia-Pacific Index fell 1%, to record its largest loss in three weeks. Japan’s Topix was off 1.5%, with financials off 2.2%. Chinese stock markets managed to buck the trend to post minor gains, but even in Shanghai, banks shares ended lower. Separately, China’s Caixin manufacturing PMI edged to 50.1 from 50.0. The average in Q3 was 50.2. That is the highest quarterly average since Q3 2014, and provides another piece of data suggesting that Chinese economy has stabilized, albeit at lower levels and with higher debt. Chinese markets are closed the next week for national holidays, though official PMI data will be reported over the weekend. |
China Caixin Manufacturing PMI(see more posts on China Caixin Manufacturing PMI, )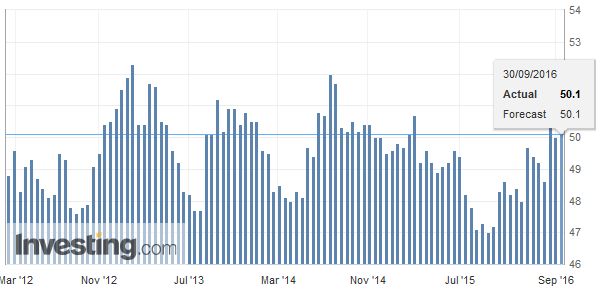 Source Investing.com - Click to enlarge |
JapanJapan released a mixed bag of data. Prices pressures continue to ease. Household spending fell more than twice what was expected. Industrial output was stronger than forecast, helped by a surge in auto output. Unemployment ticked up to 3.1% from 3.0%. Headline CPI remained negative (-0.5% vs. -0.4% year-over-year) in August, for the fifth consecutive month. Excluding fresh food, which is the BOJ preferred measure, fell -0.5% from a year ago. The measure excluding food and energy slipped to 0.2% from 0.3%. Tokyo reports its inflation figures with less of a lag, but the September data dive little hope of a recovery in the national price measures. |
Japan Construction Orders YoY(see more posts on Japan Construction Orders, )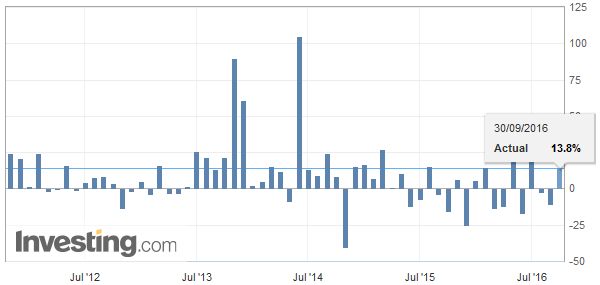 Source Investing.com - Click to enlarge |
| The BOJ reported that its staff, excluding managers, will be given a 0.2% pay increase in the base wage. This follows a 0.6% increase in the FY15, and although it is the third year that the base wage has increased, the small amount illustrates the similar pressure facing the private sector. Weak wage increases are one of the factors holding back consumption. Overall household spending fell 4.6% in August from a year ago. The Bloomberg median was for a 2.1% decline. Household spending has been contracting on a year-over-year basis since February. |
Japan Consumer Price Index(see more posts on Japan Consumer Price Index / Inflation, )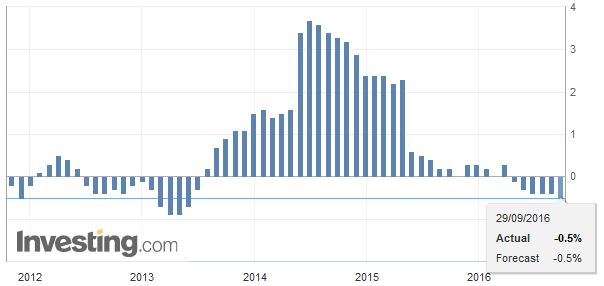 Source Investing.com - Click to enlarge |
| Industrial output rose 1.5% in August, which is three-times what the median guesstimate projected. The year-over-year pace rose to 4.6% from -4.2% in July. Vehicle production rose 8.8% after a 4.1% slide in July. Construction orders jumped 13.8% after a 10.9% fall in July. Japan will report the Q3 Tankan survey early Monday in Tokyo. Sentiment among the large manufacturers is expected to post a small increase, and capex plans are expected to improve from the 6.2% of Q2. |
Japan Unemployment Rate(see more posts on Japan Unemployment Rate, )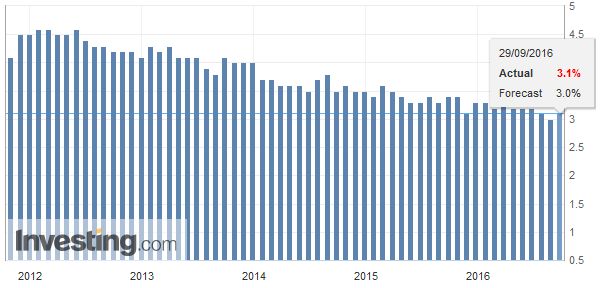 Source Investing.com - Click to enlarge |
EurozoneEurozone data was largely in line with expectations. The unemployment rate was steady at 10.1% in August, while the preliminary September CPI rose to 0.4% from 0.2%. This picks up the gains in energy, as the core rate was steady at 0.8%. |
Eurozone Unemployment Rate(see more posts on Eurozone Unemployment Rate, )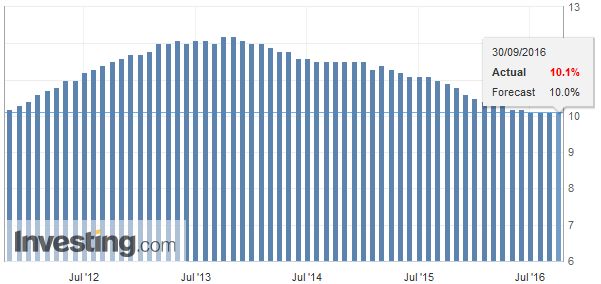 Source Investing.com - Click to enlarge |
| The euro has been pushed to new lows for the week, just below $1.1170. Last week’s low was seen near $1.1125. Barring new news, the intraday technicals suggest that the downside may have largely been exhausted in the European morning. |
Eurozone Core Consumer Price Index(see more posts on Eurozone Core Consumer Price Index, ) Source Investing.com - Click to enlarge |
| The dollar has largely matched yesterday’s range against the yen. The greenback found sellers at JPY101.80 was approached, while buyers appeared after a big figure pullback. |
Eurozone Consumer Price Index(see more posts on Eurozone Consumer Price Index, )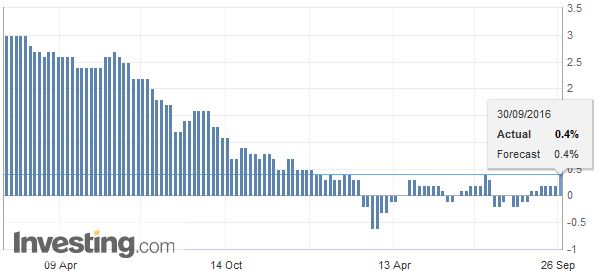 Source Investing.com - Click to enlarge |
United KingdomBetter than expected UK data failed to lend much support to sterling. Yesterday’s losses were extended, but the week’s low near $1.2920 remains intact. The intraday technicals warn that the low for the day, though, may not be in place. Still, the UK could not have hoped for better data today. The Q2 GDP estimate rose to 0.7% from 0.6%, unexpectedly, but somehow, in the machinations of GDP calculations, this turned into a 2.1% year-over-year pace, down from 2.2%. Most promising for Q3 was news that the index of services for July rose 0.4%. This is the second best of the year thus far. The median forecast was for a 0.1% increase. The June series was also revised higher (0.3% from 0.2%). |
U.K. Gross Domestic Product QoQ(see more posts on U.K. Gross Domestic Product (QoQ), )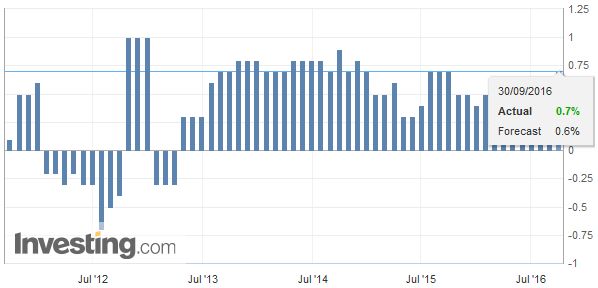 Source Investing.com - Click to enlarge |
| The Q2 current account deficit was also smaller than anticipated, while investment was stronger than expected, rising 1.0% or twice the median forecast. |
U.K. Gross Domestic Product (GDP) YoY(see more posts on U.K. Gross Domestic Product, ) Source Investing.com - Click to enlarge |
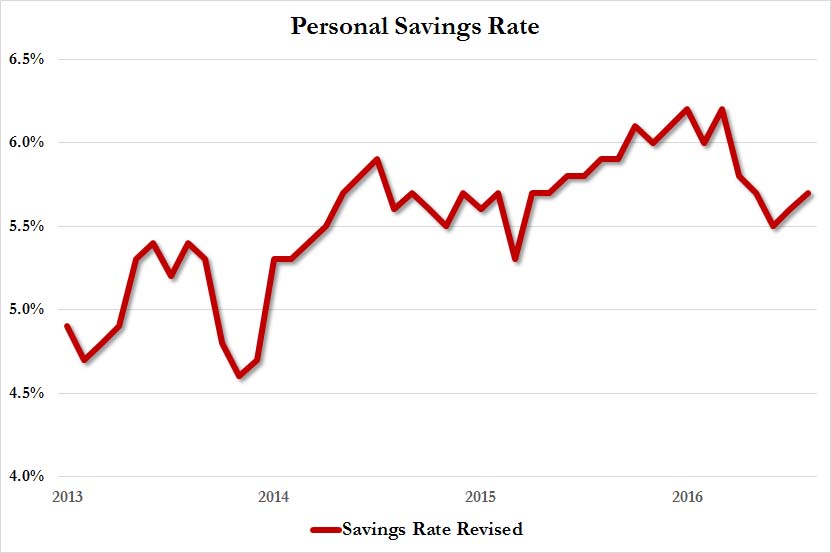
United StatesThere is a slew of North American data today. In the US, the personal consumption expenditures will be used to calculate Q3 GDP. After the improvement in the advance merchandise trade balance and inventory data, look for Q3 estimates to be raised again, with many, perhaps even the Atlanta Fed, returning toward 3% forecasts. The core PCE deflator, the Fed’s preferred inflation measure is expected to tick up to 1.7%, which would represent new two-year highs. |
U.S. Core PCE Price Index(see more posts on U.S. Core PCE Price Index (PCE Deflator), )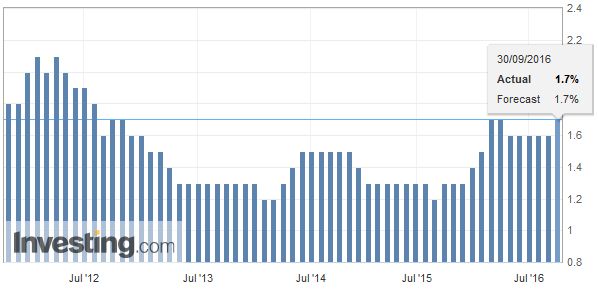 Source Investing.com - Click to enlarge
|
via Zerohedge:
|
|
|
 |
| The Chicago PMI may attract attention. It is expected to improve from the 51.5 reading in August. Lastly, the University of Michigan’s consumer confidence report and the inflation expectation will be reported. |
U.S. Chicago PMI(see more posts on U.S. Chicago PMI, )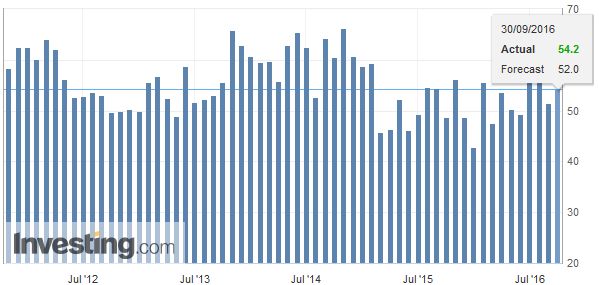 Source Investing.com - Click to enlarge |
| For its part, Canada reports July GDP. It is expected to have risen by 0.3% after a 0.6% rise in June. The monthly GDP readings in Q1 16 and Q2 16 have averaged zero. Industrial and raw material prices are expected to have fallen in August. T
The US dollar bottomed near CAD1.3050 yesterday and tested CAD1.32 in the European morning. However, the greenback’s momentum appears to have stalled. Similarly, the Australian dollar, which posted an outside down day yesterday, saw follow through selling today, but the enthusiasm waned below $0.7600 and near the 20-day moving average (~$0.7595). There is scope toward $0.7630-$0.7640. |
. |
Graphs and additional information on Swiss Franc by the snbchf team.
Full story here Are you the author?
Tags: #GBP,#USD,$AUD,$CAD,$JPY,Bank of Japan,Canada Gross Domestic Product,China Caixin Manufacturing PMI,Eurozone Consumer Price Index,Eurozone Core Consumer Price Index,Eurozone Unemployment Rate,FX Daily,Japan Construction Orders,Japan Consumer Price Index / Inflation,Japan Unemployment Rate,newslettersent,U.K. Gross Domestic Product,U.K. Gross Domestic Product (QoQ),U.S. Chicago PMI,U.S. Core PCE Price Index (PCE Deflator)