Todays “Chart of the Day” from The Economist makes an attempt to show that gold isn’t doing any better when it comes to preserving buying power than currencies such as the Swiss Franc (CHF) or the Japanese Yen (JPY). Roy Sebag, co-founder of BitGold and CEO of GoldMoney, took the liberty to point out the obvious (and many) flaws in their chart (see his comments below):
“Here is an example of how the mainstream media either purposely or inadvertently manipulates data with respect to gold, preventing the masses who have little time to invest from assessing gold’s true performance.
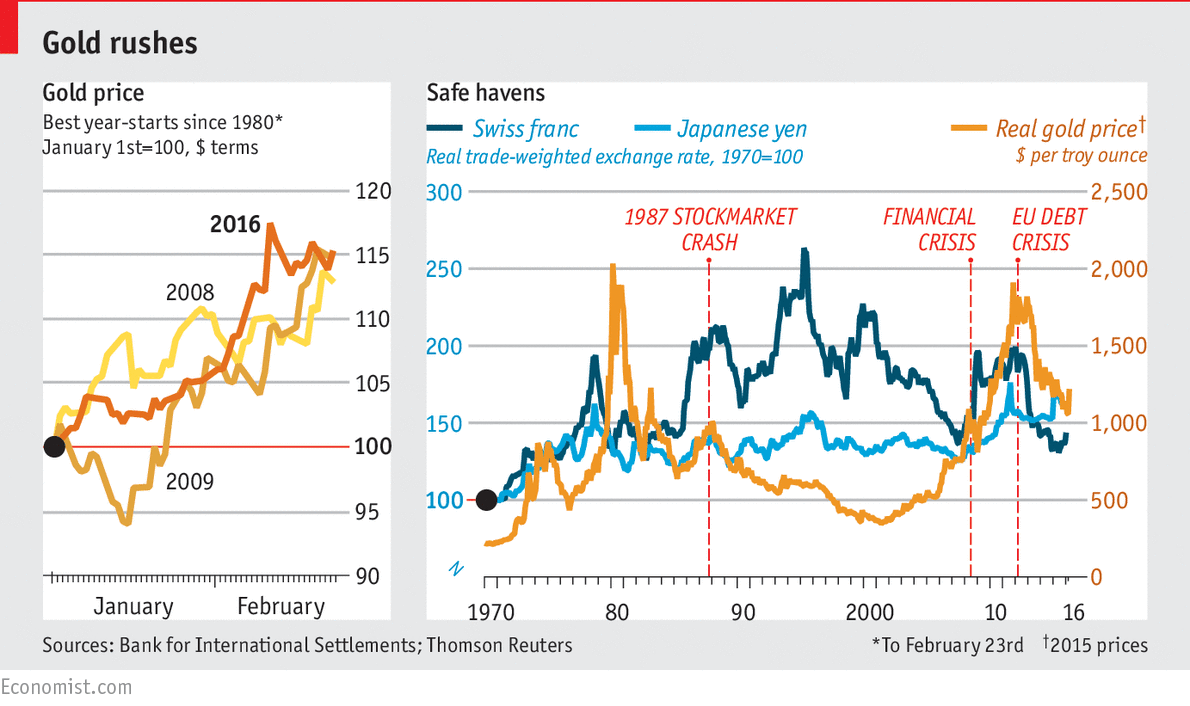
In a piece published on February 24, 2016, The Economist created this graph entitled: ”Safe Havens”. In the graph they place three data points:
“Real” Gold Price
“Real Trade-Weighted” Swiss Franc
“Real Trade-Weighted” Japanese Yen
Error #1 – The Graph has gold starting at a different axis from the currencies. What in the world would warrant that? While the Japanese Yen and the Swiss Franc start at a value of 100, the gold price appears to start at a price of around 40. This disguises the outperformance of gold and manipulates the net performance to be closer in line with the currencies.
Error #2 – You do not inflation adjust gold. Gold is an indestructible element that can be purchased once, and held forever. Thus its value should not be inflation adjusted. A Tomato, or a barrel of oil should be inflation adjusted. I also argue that one shouldn’t inflation adjust any capital investment given that earning the inflation rate of return is impossible without taking risk.
Error #3 – If a decision was made to inflation adjust gold, why weren’t the currencies inflation adjusted? Note the sleight of hand using “Real trade-weighted exchange rate” – This is not equivalent to deflating a fiat currency by its local CPI equivalent
The author of this graph should have known better unless they have zero experience with econometrics and basic data science.”
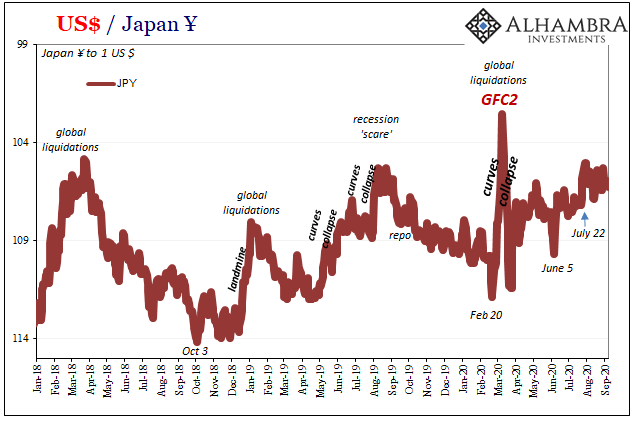
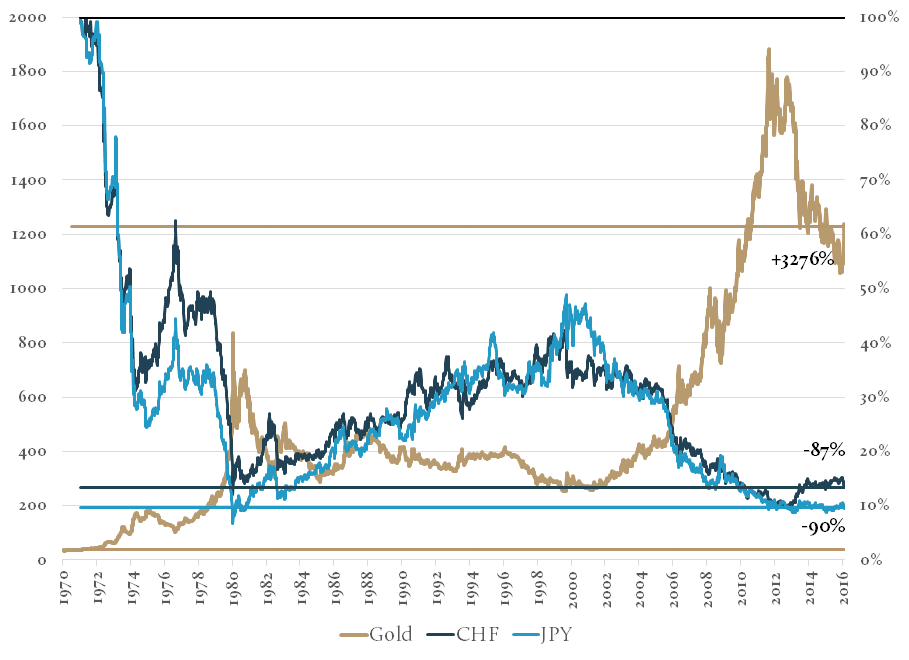
Here is what the actual chart comparing CHF and JPY to gold would have looked like. While the CHF and the JPY preserved value better than the USD, both currencies are still down 87% and 90% vs gold, respectively.
Full story here Are you the author?
Tags: gold price manipulation,Japanese yen,The Economist