George Dorgan
My articles My siteAbout meMy videosMy books
Follow on:LinkedINTwitterSeeking Alpha
CFA SocietyEconomicBlogs
August 2013 Update
Emerging markets: Years of strong increases in wages combined with tapering fears have taken their toll resulting in higher costs and lower availability of investment capital. EM Companies have issues in coping with developed economies. Some of them even need to shed jobs.
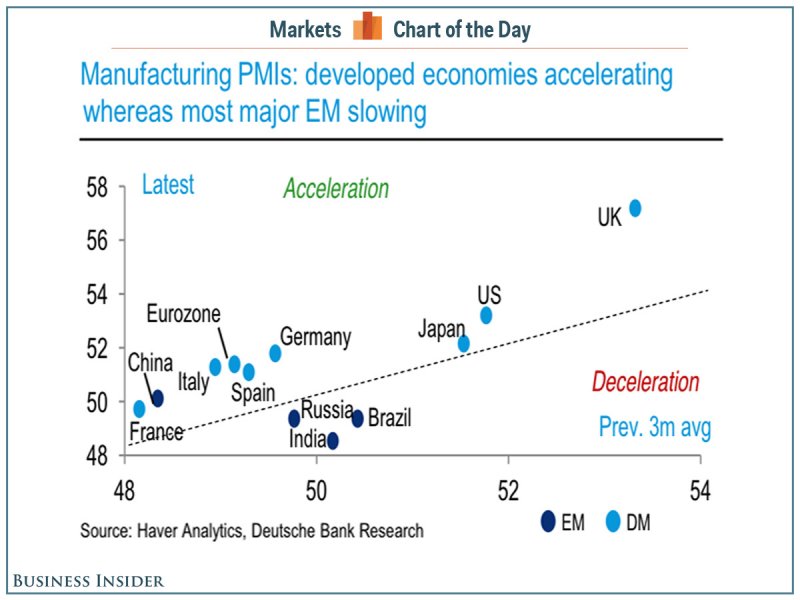
European recovery continues while most Emerging Markets struggle and US slows
The following graph shows the average PMIs for the different geographical areas. The picture clearly shows that the speed of the U.S. recovery has slowed, while Europe and China are catching up now. Emerging Markets have been hit most by rising wages, with countries like Indonesia, India and Brazil still having issues. The slowing of the US manufacturing growth was visible in the relatively weak Markit manufacturing index of 53.1, while the ISM index still expanded.

Click on graph to expand
JP Morgan’s global PMIs vs. different risk indicators
| Month | Manu factur. | Services | Com posite | Michigan Consumer Confidence | S&P 500 | Copper | Brent Oil | AUD/ USD | Reference date |
|---|---|---|---|---|---|---|---|---|---|
| August 2013 | 51.7 | 56.1 | 55.2 | 82.1 | 1645 | 3304 | 115.70 | 0.9053 | Sep 3, 2013 |
| July | 50.8 | 54.9 | 54.1 | 85.1 | 1703 | 3168 | 108.93 | 0.8903 | August 2, 2013 |
| June | 50.6 | 51.3 | 52.9 | 84.1 | 1615 | 3176 | 105.85 | 0.9116 | July 3, 2013 |
| May | 50.6 | 53.7 | 53.1 | 84.5 | 1640 | 3297 | 99.92 | 0.9750 | June 3, 2013 |
| April | 50.4 | 52.1 | 51.9 | 76.4 | 1582 | 3126 | 102.85 | 1.0253 | May 3, 2013 |
| March | 51.2 | 53.2 | 53.1 | 77.6 | 1554 | 3354 | 107.17 | 1.0424 | April4,2013 |
| February | 50.8 | 53.3 | 53.0 | 73.8 | 1525 | 3508 | 110.08 | 1.0202 | March4,2013 |
| January | 51.5 | 53.4 | 53.3 | 71.3 | 1503 | 3658 | 113.46 | 1.0427 | Feb4,2013 |
| December 2012 | 50.2 | 54.8 | 53.7 | 74.5 | 1461 | 3700 | 111.42 | 1.0481 | Jan 5, 2013 |
| November | 49.7 | 54.9 | 53.7 | 82.7 | 1407 | 3656 | 110.92 | 1.0432 | Dec 3 |
| October | 49.2 | 52.1 | 51.3 | 82.6 | 1423 | 3557 | 105.75 | 1.0338 | Nov 3 |
| September | 48.9 | 54.0 | 52.5 | 78.3 | 1437 | 3775 | 108.07 | 1.0231 | Oct 3 |
| August | 48.1 | 52.3 | 51.1 | 74.3 | 1406 | 3485 | 108.07 | 1.0239 | Sep 3 |
| July | 48.4 | 52.7 | 51.7 | 72.3 | 1361 | 3307 | 106 | 1.0465 | Aug 2 |
| June | 48.9 | 50.6 | 50.3 | 73.2 | 1357 | 3466 | 97 | 1.0230 | Jul 2 |
| May | 50.6 | 52.5 | 52.1 | 79.3 | 1263 | 3289 | 98 | 0.9640 | Jun 3 |
| April 2012 | 51.4 | 52.0 | 52.3 | 76.4 | 1402 | 3782 | 116 | 1.0260 | May 2, 2012 |
| September 2011 | 49.9 | 52.6 | 52.0 | 55.7 | 1123 | 3132 | 102 | 0.9634 | Sep 2, 2011 |
| February 2011 | 57.8 | 59.3 | 57.0 | 77.5 | 1331 | 4498 | 115 | 1.0127 | Mar 2, 2011 |
Longer time overview
China and other emerging markets came far more quickly out of the 2008/2009 recession. In 2009 and 2010, the Fed fueled the Chinese, Brazilian and other emerging markets’ recoveries and housing bubbles with cheap money. The Chinese government helped with a huge investment program. Due to the depressed housing market, the US could not recover that quickly.
In 2010/2011, Germany and the Euro zone followed the Chinese expansion thanks to strong German exports. In 2011, rising gas and falling home prices caused the United States to slow down.
The explosion of the euro crisis and the following austerity radically stopped European expansion in the second half of 2011. European PMIs fell from 57 to 47 in a couple of months. The United States was not impressed by the euro crisis at all, but thanks to cheaper gas prices and the flow back of funds into the US, they recovered at the end of 2011. From April 2012 onwards, all global economies were weakening. This tendency could be stopped by liquidity injections from global central banks in September 2012 and was followed by seasonal improvements until February 2013.

Global PMIs December 3, 2012 - Click to enlarge
For an overview of the euro zone PMIs see this page.
Next page: Which indicators are the leading ones?