George Dorgan
My articles My siteAbout meMy videosMy books
Follow on:LinkedINTwitterSeeking Alpha
CFA SocietyEconomicBlogs
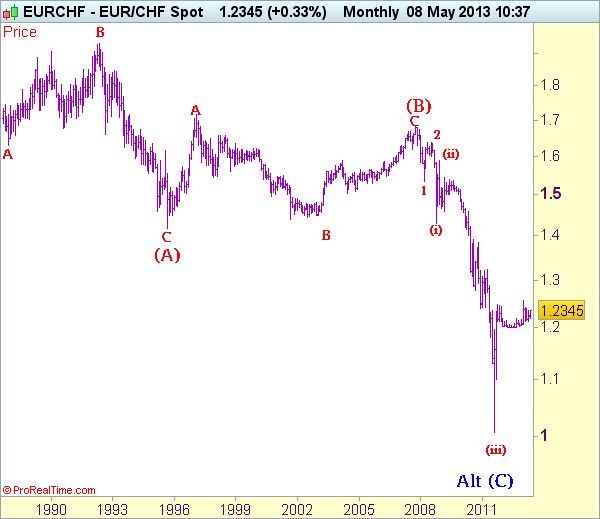
The following is a contribution by action forex, the latest update in May 2013, a time when EUR/CHF was at 1.2347
EUR/CHF: Wave (iv) of 3 of (C) ended at 1.3835 and wave (v) / 3 has ended at 1.0075
The Long-Term Analysis
The long-term downtrend started from 1.9626 (Apr 1985) to 1.4166 (Sep 1995) is treated as wave (A) with
A:1.6285 (Dec 1987),
B: 1.9342 (May 1992) and
C: 1.4166,
then wave (B) ended at 1.6828 with A: 1.7147 (Feb 1997),
B: 1.4398 (Sep 2001),
C: 1.6828 (Nov 2007), therefore, wave (C) is now in progress with the breakdown indicated as above. This wave (C) already met indicated downside target at 1.1455/60 and 1.1300, it could have ended at 1.0075 or may extend one more fall to 1.0000 before major correction.
Wave C effectively continued
Why Elliott Wave is compatible with fundamental analysis?
Elliott wave analysis reflects first long-term trends, e.g. the continuing appreciation of the CHF against EUR due to lower taxes, higher competitiveness, better trained personnel (see more) and consequently lower inflation (see the inflation rate parity).
Secondly it mirrors long-term capital movements, for example:
- 1990-1992: Wave A to top of wave B: EUR/CHF rises, Swiss capital moves to Germany to finance the German reunification and to profit on higher German rates. Excessive and overblown spending.
- 1992-1996: Wave B to bottom wave (A): EUR/CHF falls with European monetary system breakdown after 1992 to the bottom in 1995.
- 1996-1998 From bottom wave (A) to A: EUR/CHF rises: Swiss housing crisis, optimism in periphery thanks to euro introduction until 1998 during the Asia crisis.
- 1998-2003: EUR/CHF falls after German fiscal austerity in 1997. EUR at 0.80 USD and 1.43 CHF in the year 2002.
- 2003 – 2007 Wave B: The housing bubble in the European periphery and the capital flows from Switzerland to finance that bubble. That led EUR/CHF to 1.68.