George Dorgan
My articles My siteAbout meMy videosMy books
Follow on:LinkedINTwitterSeeking Alpha
CFA SocietyEconomicBlogs
In this post we present financial and credit cycles in history. In this serial the period between 1998 and 2002. At the time, Germany was a weak economy under many other weak ones with slow GDP growth. The stock market and dot com bubble that was mainly concentrated on the United States and other related economies intensified between 1998 and 2001. A (ir)rational expectation was that new technologies would led us to unbelievable growth. For people analyzing financial cycles, it was a U.S. bubble financed with rigid austerity in Europe and Asia.
The Euro introduction austerity and the post Asia Crisis austerity
The German government finally decided to stop deficit spending and to implement austerity from 1996 onwards (see previous financial cycle), but also to enable the euro and the fulfilment of the strong Maastricht convergence criteria. Germany became the “sick man of Europe” and the German balance sheet recession started. Germany was considered a weak economy under many other weak ones. German capital flew into the United States. The credit cycle in Eastern Germany busted, because it was financed mostly with debt and did not have real productivity gains. Between 1996 and 2002, Germany paid 5% interest for 10 year government bonds, which is comparable to the high yields of Spain or Italy in 2011/2012, but only had 0.5% real growth.

click to expand , Source
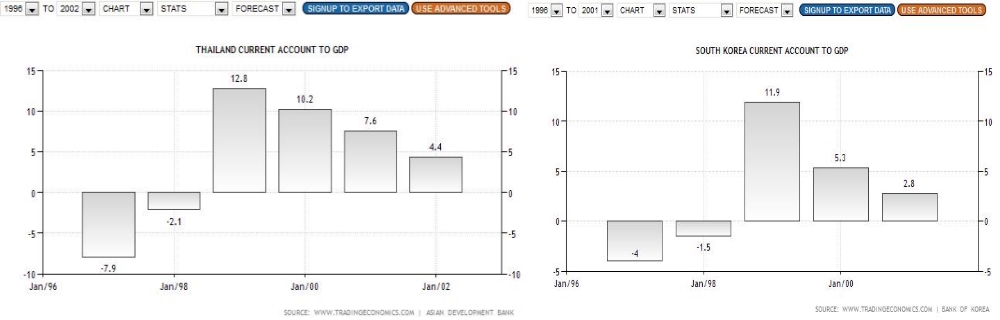
In 1998, the Asian crisis and the Russia crisis put more fuel into the fire: less demand from Asia and Russia weakened European exporters. To comply with investors, Asian countries were obliged to achieve high current account surpluses, here the example of Thailand and South Korea.
1998 – 2002: Rise of the stock market and the dot com bubble

The Nasdaq during the dot com bubble
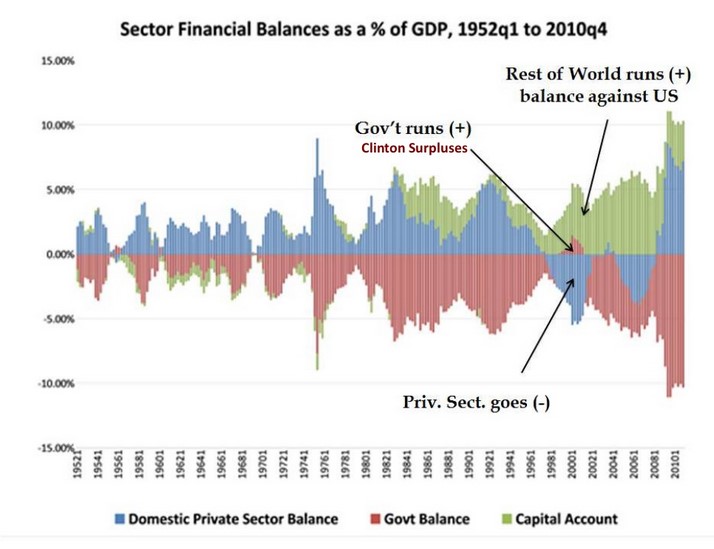
source Modern Monetary Theory, Stephanie Kelton
The technological revolution around PC, internet and telephony helped to increase productivity. The United States was the leader in this technological development and the dollar appreciated.
European and Asian austerity kept the oil low price low. The U.S. went into a phase of overspending that the Fed tried to limit with higher rates. The long USD carry trade against EUR was on vogue.
Until 1997, that dollar improvement episode was assisted by stronger demand for U.S. products triggered by emerging consumer demand from former communist nations and the extreme fiscal spending with the German reunification. From 1997 onwards, however, it was the combination of excessive debt-based household spending in the U.S., irrational exuberance in U.S. investments and companies and austerity in the rest of the world. The slide from the Modern Monetary Theory, show how the U.S. private sector goes nagative during the so-called Clinton boom and how high Fed rates try to convince Americans to save more.

EUR/USD in the 1990s
The euro fell from 1.20 to 0.85 US dollars in 2001, until the strong dollar and higher rates drove the US into a recession. Finally the Fed lowered rates again. The euro finally recovered and started a similar bull run from 0.85$ to 1.60$ in 2007.
Japan remained the pay-master for GDP growth in the U.S. The Japanese further extended their current account surpluses and financed the US spending excesses with capital flows (see the Net External Position of Banks)
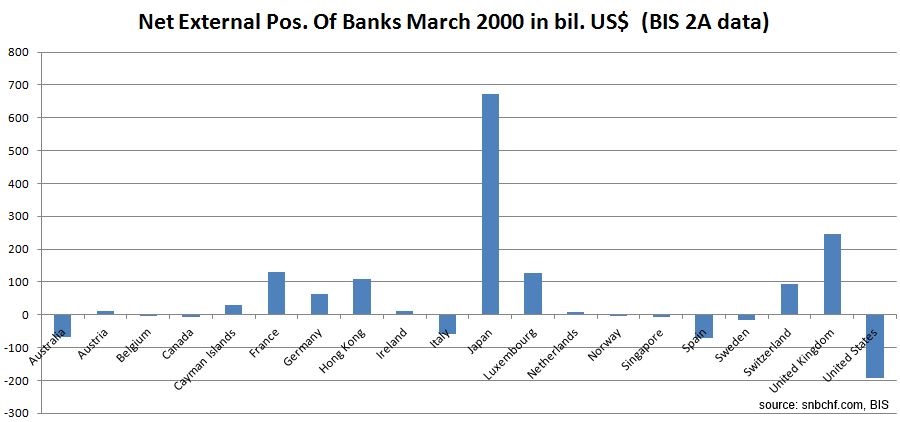
Japan is the biggest financier of GDP growth in the US during the dot com bubble
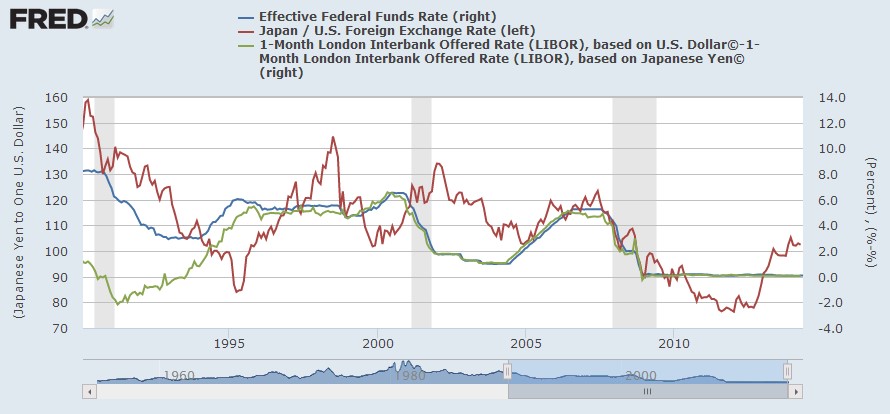
But as opposed to the previous financial cycle, from 1995 onwards the US dollar became stronger against the yen; the reason again: The Long US Dollar Carry Trade. The graph below shows how the Fed slightly tightened until 1999 (blue line). The green line shows the carry trade, the rate differential between USD Libor and JPY Libor. This difference went up to 6% in 1999.
The major victim of the strong dollar, however, was gold that fell to around 300$ caused by weak global growth, weak oil price and the strength of the American economy – facilitated with private debt. Inflation during that period was largely driven down by the new supply of cheap labor in China, technological improvements and in particular by European and Asian austerity and weak oil prices.
Central banks got impressed by low inflation and strong U.S. growth ignoring the high increase of U.S. private debt. These central planners started the second gold demonetization phase, some decided to sell their gold, the biggest the Swiss National Bank gold sales and the Bank of England gold sales. They reduced their holdings of the yellow metal when prices were at their lowest in 20 years.
<– Back to overview of financial cycles
Read more details:
Why was the gold price so low in 1999/2000?
The ECB interventions in the year 2000
2014: A repetition of history? The Dollar, the ISM, Buy American and Irrational Exuberance